
Euro Talking Points:
- EUR/USD remains in a bullish posture following the break of the bull pennant and the inverse head and shoulders pattern.
- With Christine Lagarde sounding less-dovish at the most recent ECB meeting, saying the disinflationary process was over and that the Eurozone was in a good place, this contrasts well with a US Federal Reserve widely expected to kick into a rate cut cycle at their meeting next week.
- I’ll be looking into the USD across several currency pairs ahead of the FOMC rate decision, EUR/USD included. You’re welcome to join, click here to register.
The big day is near, with the Federal Reserve widely expected to kick off a rate cutting cycle at next Wednesday’s meeting. At this point markets have built a massive expectation for several cuts after that and into the end of next year, and this sets the stage for the Fed’s projections to be the major driver at that meeting.
But for EUR/USD, perhaps a more important item has already shown from some comments from ECB President Christine Lagarde at this week’s ECB meeting. She said that the disinflationary process was over, and that the Eurozone economy was in a good place. This implies that the ECB is done with rate cuts, and that contrasts well with the Federal Reserve that’s expected to start a rate cut cycle next week and continue that with more cuts at successive meetings.
From a technical perspective, there’s a similar bullish backdrop in EUR/USD as the pair pushed up to a fresh monthly high to start the week, and this comes after breaking out from both a bull pennant and an inverse head and shoulders pattern – both of which are bullish formations.
I went over this on the Tuesday webinar to highlight follow-through interest, focusing in on two spots of support that came into play later in the week. The zone from 1.1675-1.1686 was huge, and that ultimately helped to push a pivot on Thursday morning around the ECB meeting and the CPI report. And then the support level at 1.1704 was in-play on Friday morning, and that came into the picture after a clean resistance hold, and a short-term higher-high at the 1.1748 Fibonacci level.
This short-term series of higher-highs and lows further keeps the door open for bulls to make a push towards a breakout next week.
EUR/USD Four-Hour Chart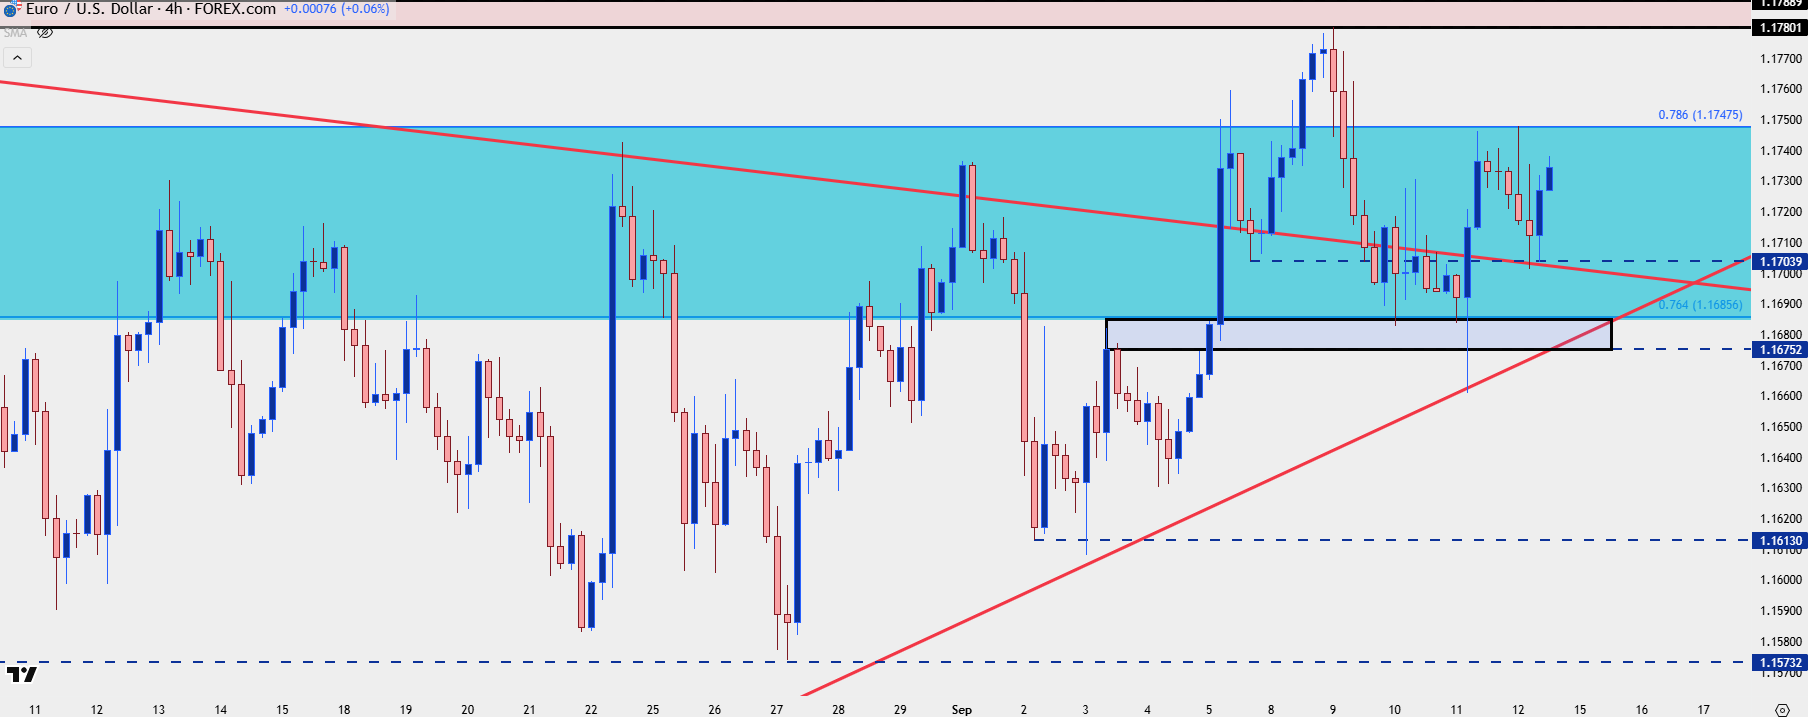
Chart prepared by James Stanley; data derived from Tradingview

EUR/USD Daily
From the daily chart we can see just how choppy and indecisive the first two months of Q3 have been. After EUR/USD set a fresh high on day one of the quarter, a strong pullback developed in July with the pair moving down for a re-test of the 1.1400 handle. And while prices came back in July, bulls were continually thwarted at lower-highs, thereby leading to the build of the bearish trendline.
But – there was also a bullish trendline in-play which helped to make a symmetrical triangle, and while those normally come with no directional bias given that it’s basically just showing digestion, the preceding trend was so strong that a deduction could be added, setting up the bull pennant formation.
What was notable about the past week is that bulls finally were able to press up to a higher-high, albeit falling short of the lower-high from July. But that now makes up a resistance zone from 1.1780-1.1789, and a breach of that exposes the three-year high at 1.1830.
On a shorter-term basis, that 1.1748 level can soon become higher-low support potential on breakout tests that don’t continue to run, but traders would likely want to see at least a press into the 1.1780 level to keep that scenario as attractive.
EUR/USD Daily Chart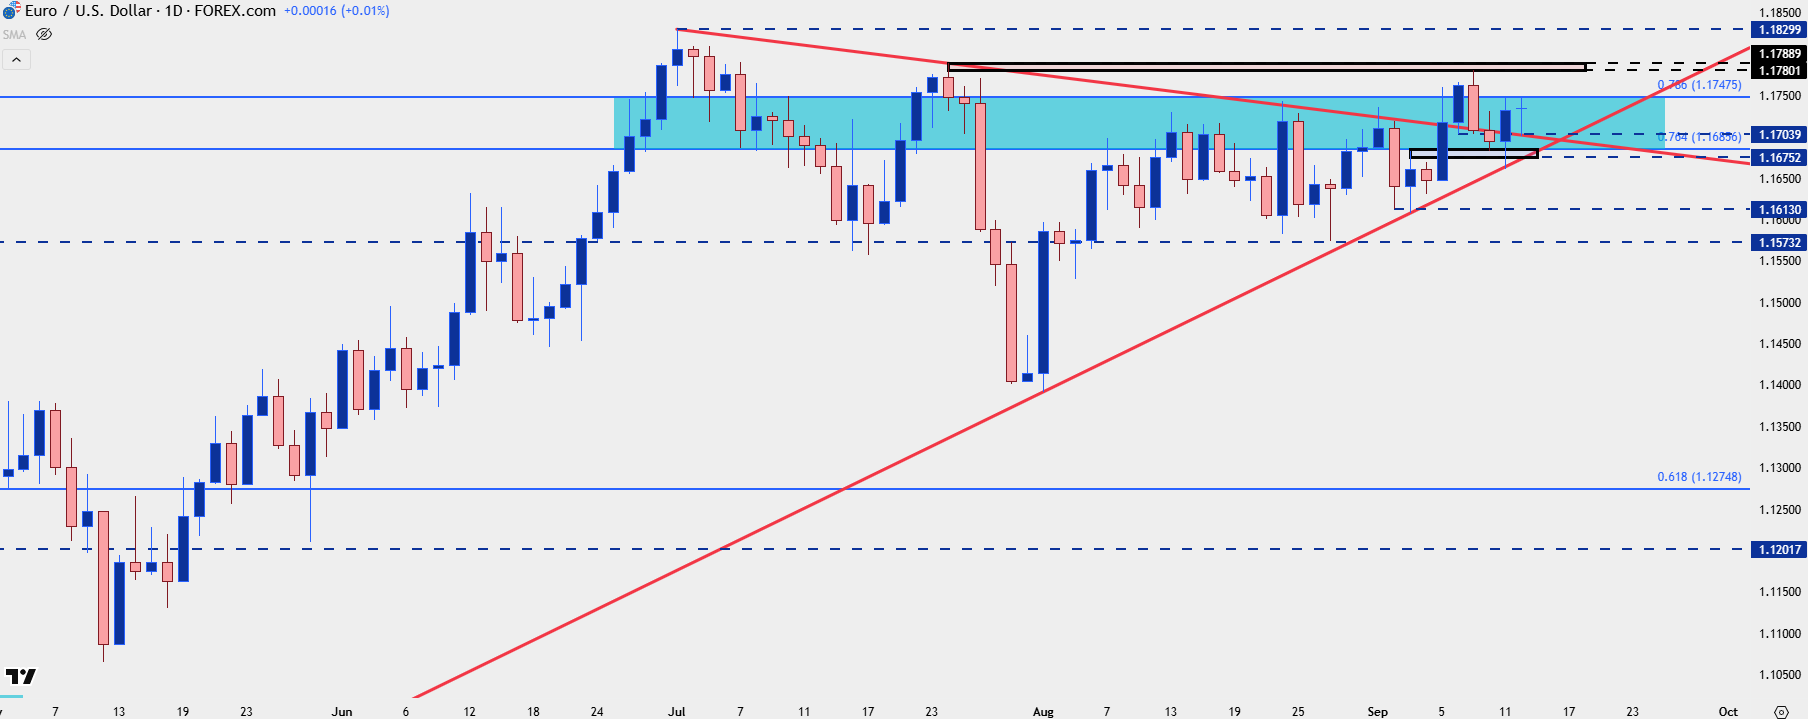
Chart prepared by James Stanley; data derived from Tradingview
--- written by James Stanley, Senior Strategist