
US Dollar Talking Points:
- The US Dollar is up since last week’s rate cut announcement out of the Fed, and this resembles last year’s start of rate cuts from the FOMC and that’s echoed in Treasury yields.
- At this point, EUR/USD retains bullish structure and if the Dollar is going to show advance, it’ll probably need breakdown in EUR/USD. GBP/USD also has bullish appeal, speaking to USD-weakness scenarios; while USD/JPY and USD/CAD both line up more attractively for USD-strength to take over.
- This is an archived webinar and you’re welcome to join the next one. Click here to register.
Last year’s start of rate cuts from the FOMC produced probably the opposite result that the Fed was hoping for in rates markets. Both the 10 and 30-year Treasuries hit low yield marks just ahead of the first rate cut announcement in 2024, and as the Fed highlighted more cuts along the way and then actually cutting twice more in Q4, Treasury yields continued to jump.
This is something that many market participants, especially new ones, might be vexed by – the fact that Fed rate cuts don’t necessarily mean lower Treasury rates. This is relevant because mortgages and, in-turn, the real estate market, are more vulnerable to 30-year rates than they are the overnight rates that the Fed adjusts.
Last year illustrates this divergence quite well, as longer-term Treasury rates jumped as the Fed announced their first rate cut of the cycle, and continued to jump into the end of the year. A culprit behind the move was inflation expectations as the Fed cut as inflation was already elevated and above target, and this made the prospect of holding longer-term Treasuries less attractive, as higher rates of inflation would further erode the real return of those yields. There was also an opportunity cost, as the Fed cutting even with stocks at all time highs made for a more attractive backdrop for corporates, which in-turn drove money into stocks and out of bonds.
We’re still within the first week of this rate cut cycle but already Treasury yields have inclined, and the US Dollar remains above the low that printed right at the announcement of the rate cut. In this webinar, I looked at the dynamics of that in several different markets.
US Dollar Four-Hour Chart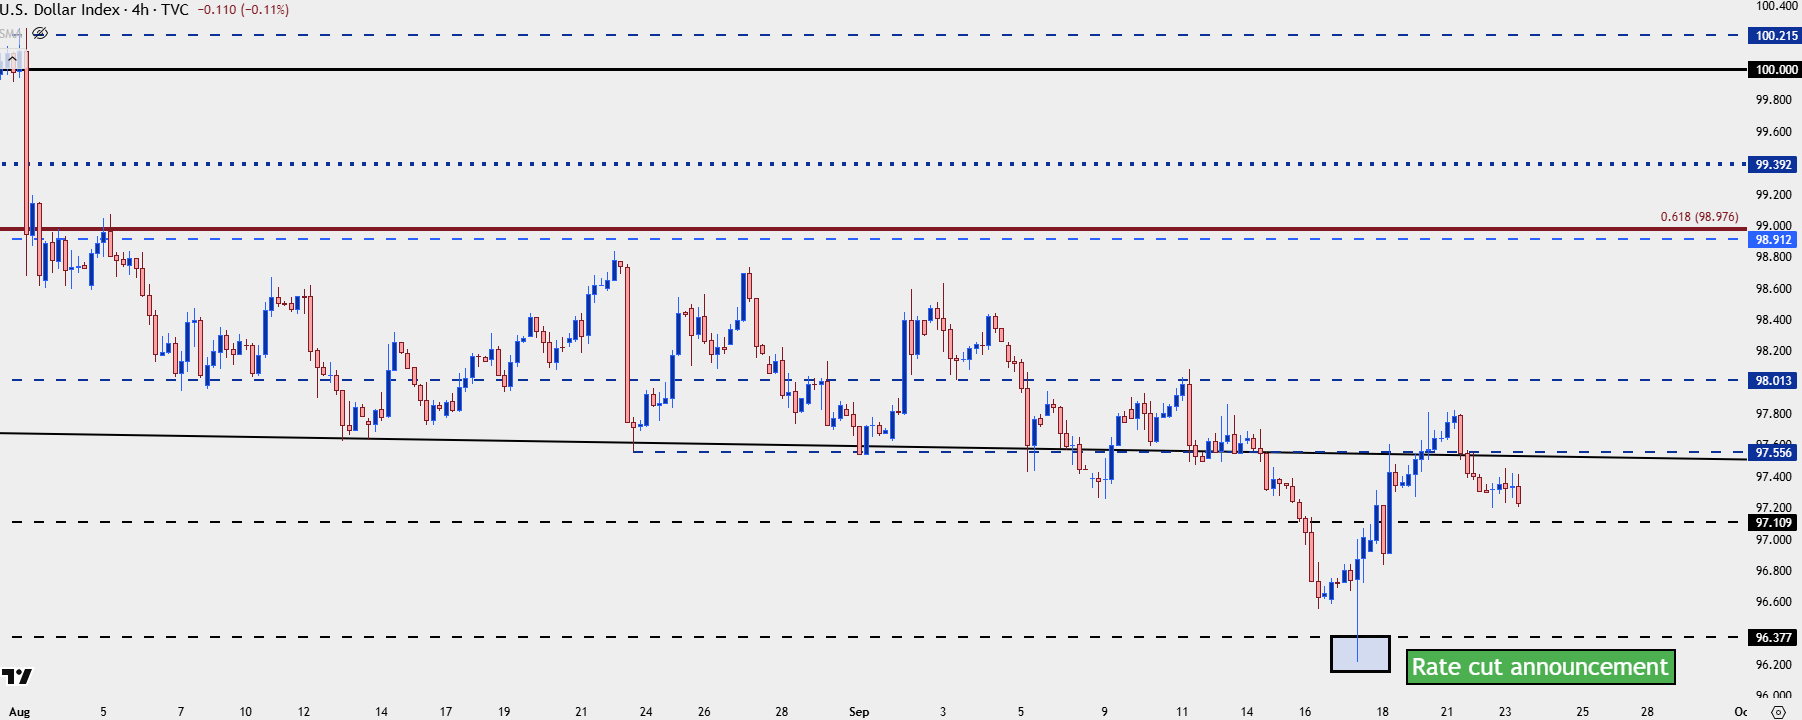
Chart prepared by James Stanley; data derived from Tradingview
EUR/USD
EUR/USD retains bullish structure at this point and this is a key component for USD trends. If we are going to see USD bulls take-over, they’ll likely need some help from EUR/USD bears chewing through some of that recent support structure. But, as looked at last Friday and then again yesterday, the bullish structure in EUR/USD currently remain in-place, as there’s been a hold of both the upward-sloping trendline and the 1.1748 Fibonacci level.

EUR/USD Four-Hour Chart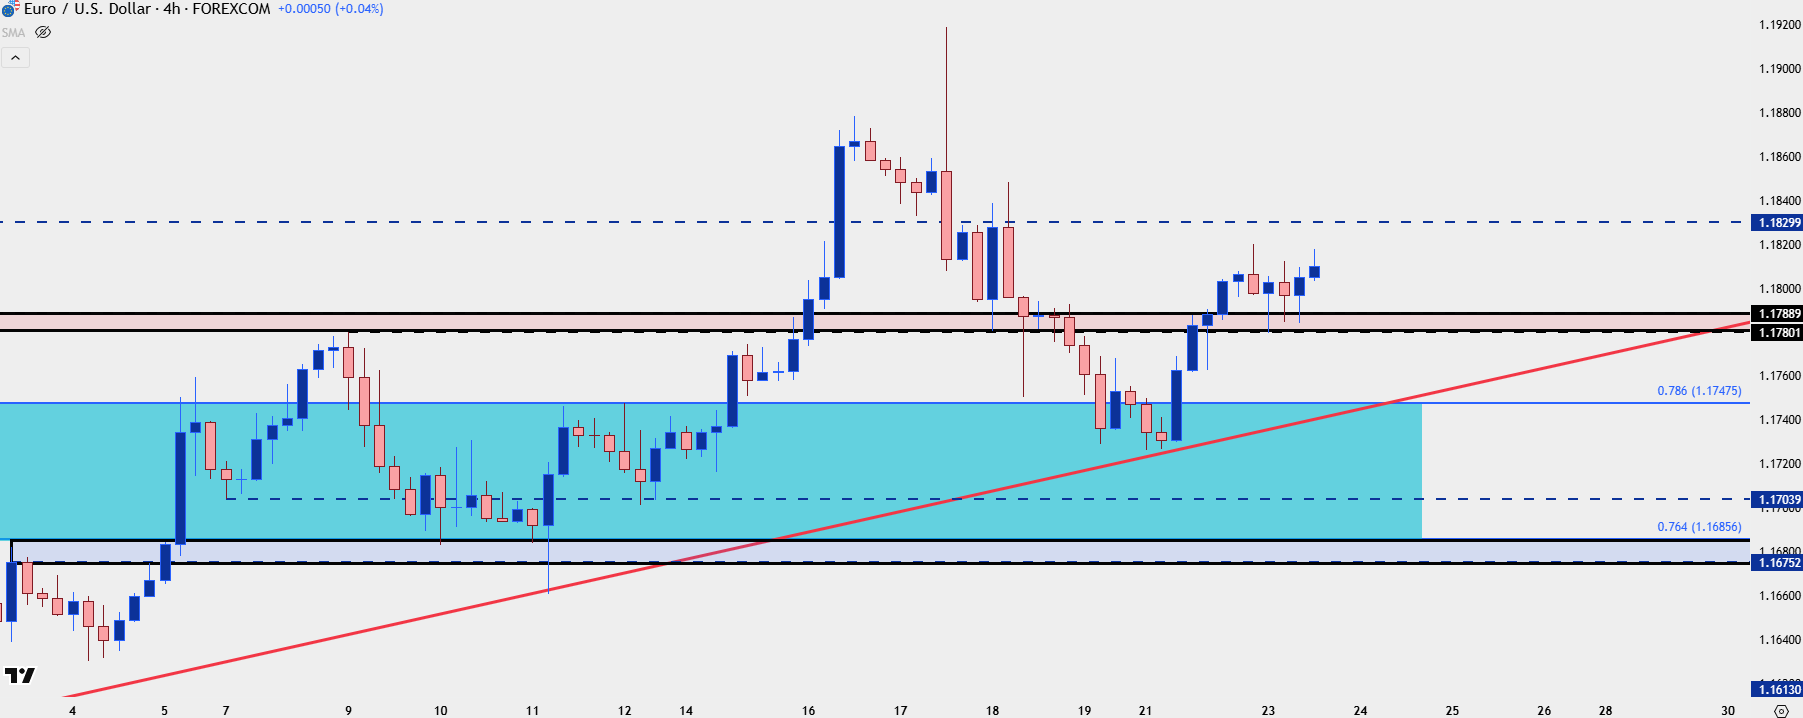
Chart prepared by James Stanley; data derived from Tradingview
GBP/USD
I looked into this last week and now it’s become a bit more clear that EUR/USD is growing in attractiveness vs GBP/USD for USD-weakness scenarios. But with that said, I’m still not at a point where I’m looking for USD-strength in Cable, and instead, there’s a shorter-term series of higher-highs and lows that could be worked with and the 1.3500 level is back in the equation as support potential, very similar to what I looked at in the webinar two weeks ago.
GBP/USD Four-Hour Chart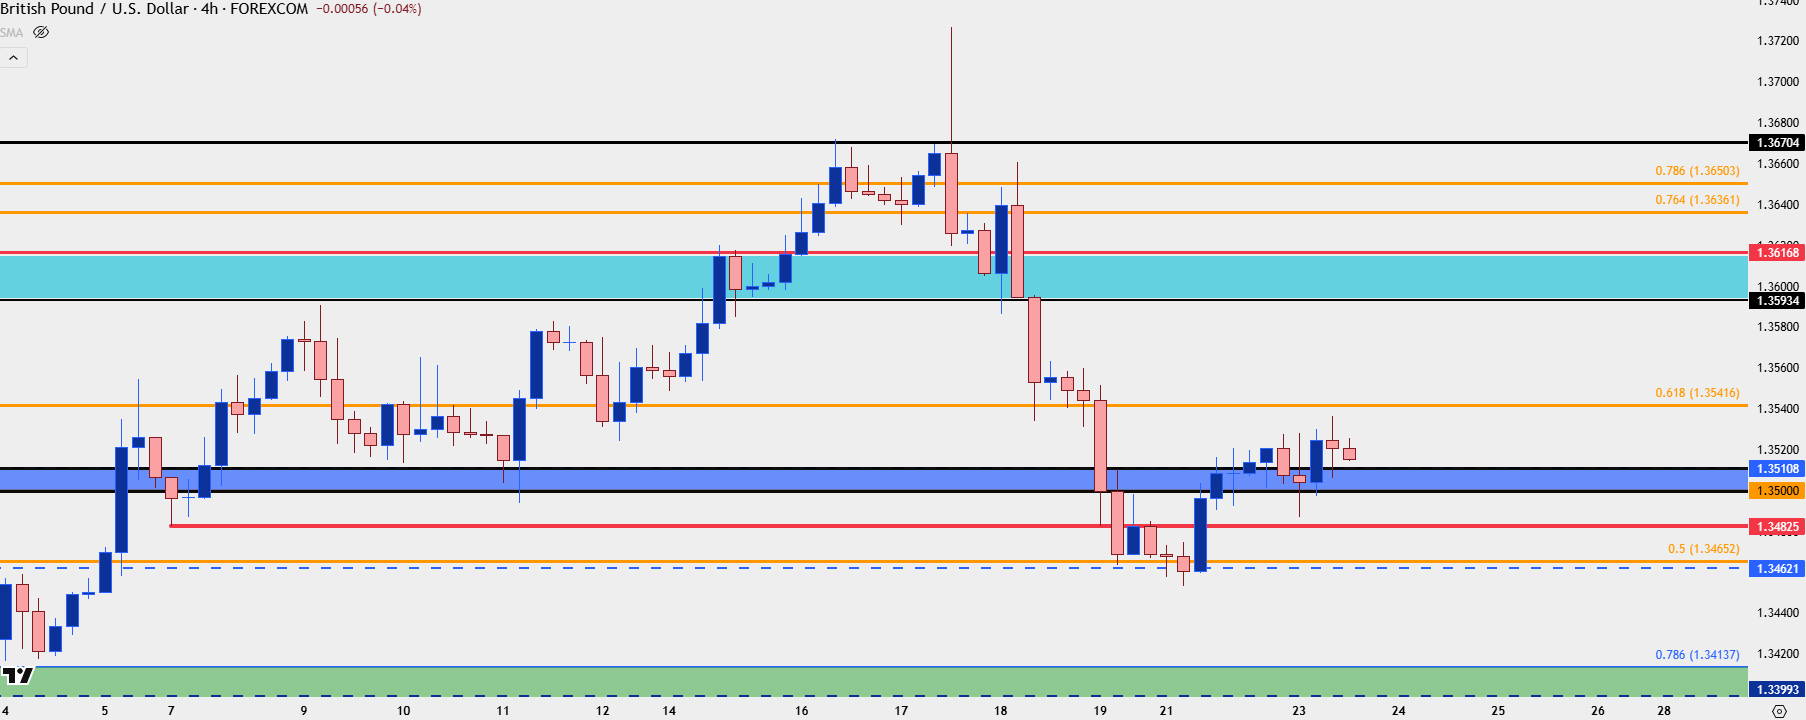
Chart prepared by James Stanley; data derived from Tradingview
USD/CAD
For USD-strength USD/CAD still stands out, and the structure here remains intriguing, again following what I had highlighted in the webinar from the week before.
Another higher-low printed last week – with that low showing one pipette, or one tenth of a pip above the prior higher-low. I talked about this in an article on Thursday and that led to strength on Thursday and Friday, and there remains bullish potential for the pair.
USD/CAD Daily Price Chart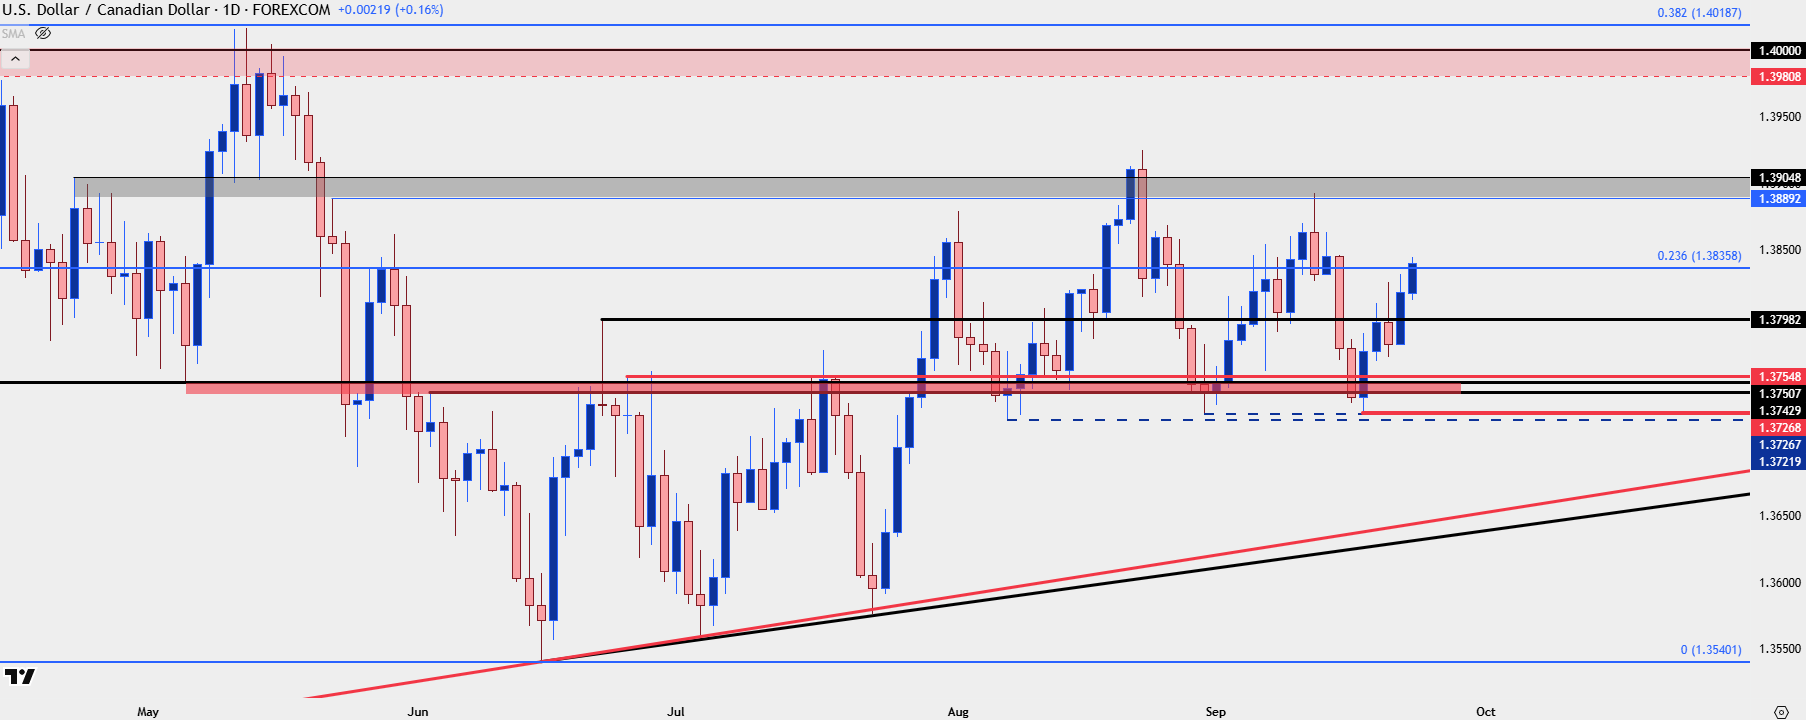
Chart prepared by James Stanley; data derived from Tradingview
USD/JPY
I wrote about USD/JPY at length in yesterday’s Japanese Yen Price Action Setups article, and the pair has since put in another hold of a key resistance level. I’m keeping the pair on the USD-strength side of the ledger for now and the higher-lows over the past five months are a large reason as to why. Shorter-term, the range remains in place and I think this continues to give both USD and USD/JPY bulls a degree of preference, although Yen-weakness is a theme that’s likely more attractive elsewhere, such as EUR/JPY and perhaps even GBP/JPY.
If we do see a USD breakdown, it’s USD/JPY that could prove problematic, as further carry unwind could threaten to become a de-leveraging event for global markets. The 140.00 level seems a clear line in the sand for that and given that price remains more than 600 pips away at this point, that doesn’t appear to be a near-term concern. That can change if we do see USD bears get back in-control, however, and that will probably need some help from US inflation data with the next piece of that puzzle to be released on Friday with Core PCE.
USD/JPY Daily Price Chart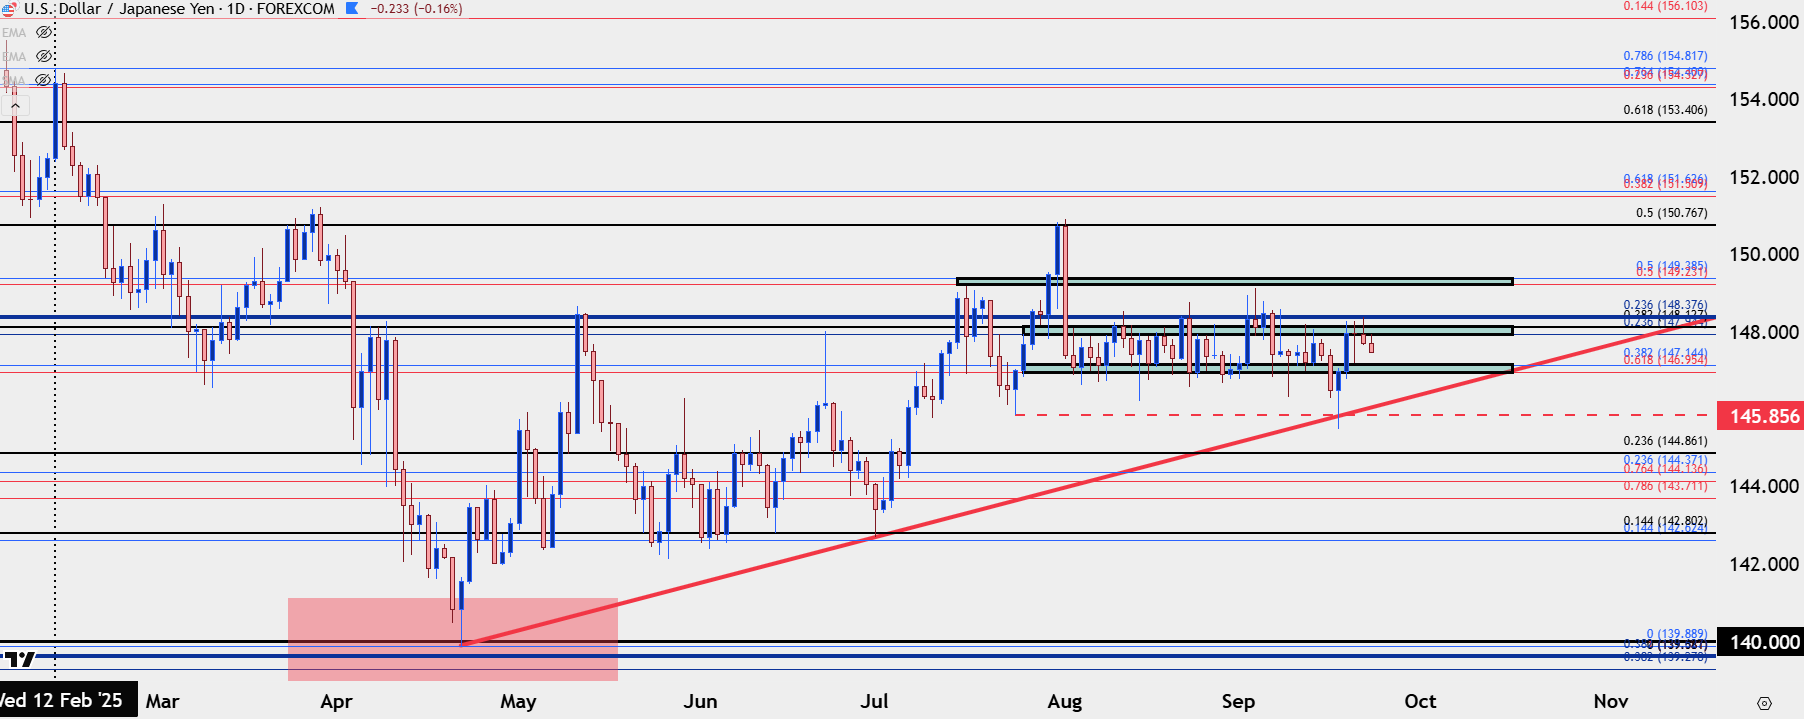
Chart prepared by James Stanley; data derived from Tradingview
--- written by James Stanley, Senior Strategist