


- New Zealand CPI overshoots, sticky core pressure remains
- Non-tradables inflation hot at +1.1% QQ
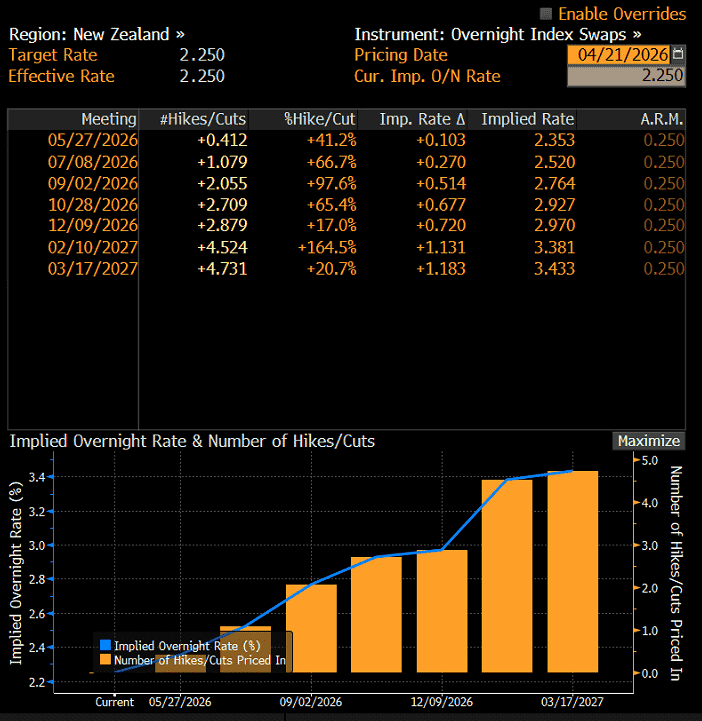
- RBNZ hike odds jump, full move by July
- NZD/USD testing .5920 resistance
Kiwi inflation turns up the heat
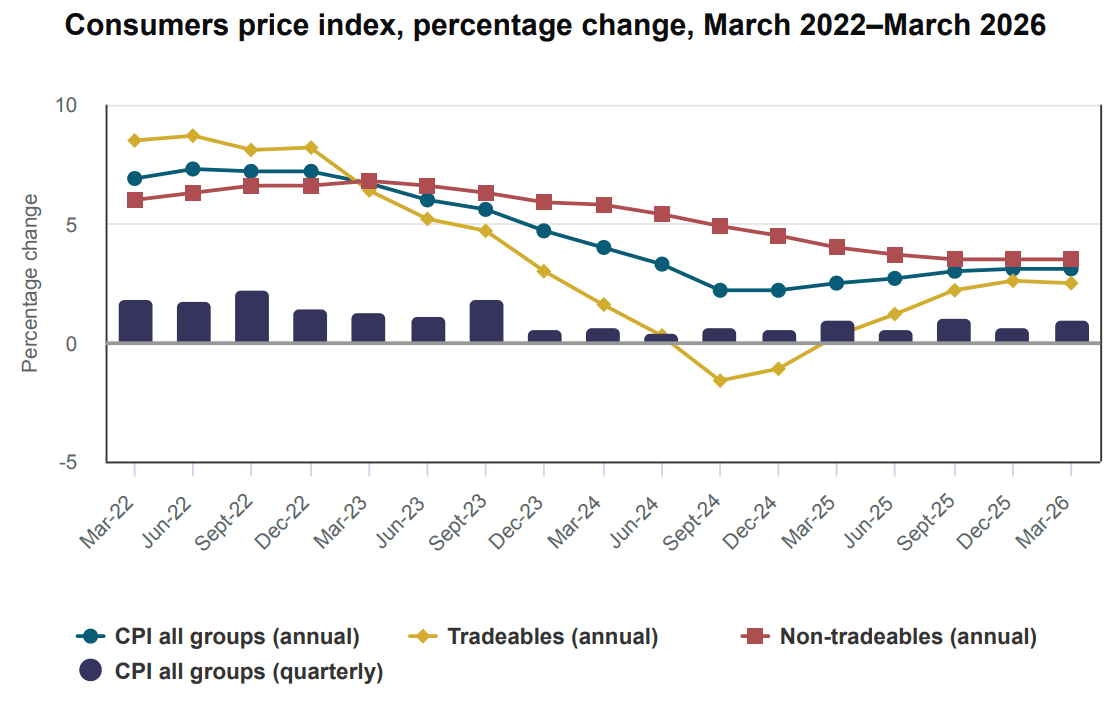
New Zealand’s March quarter CPI report printed firmer than forecast, with headline inflation rising 0.9% over the quarter against expectations for 0.8%, leaving the annual rate unchanged at 3.1%, above both market and RBNZ forecasts.
Beneath the surface, the details were uncomfortable. Non-tradables inflation, the domestically driven component linked to local demand, labour costs and administered prices, rose 1.1% over the quarter, above the Bank’s implied 0.9% track, while holding at 3.5% over the year.
Source: StatsNZ
Tradables inflation, largely influenced by offshore factors such as global goods prices, shipping costs, fuel and the exchange rate, also surprised on the upside at 0.7% over the quarter and 2.5% over the year. However, the full pass-through from the Iran war and related supply disruption risks is unlikely to be captured until the June quarter data released in July.
Core measures offered little relief. CPI ex-fuel held at 3.2% over the year, while CPI ex-fuel and food edged up to 3.0%. Several broader gauges remain near the top of, or above, the RBNZ’s 1-3% target band. That leaves the starting point for the expected inflation acceleration already uncomfortable, especially with imported price pressures likely to build further in the current quarter.
July RBNZ hike now fully priced
Source: Bloomberg
On the back of the data, swaps markets pushed the implied probability of an RBNZ rate hike by May up to 41%, with a full move now priced by July. By the end of the year, nearly three full hikes are priced, an outcome that would take the cash rate back to 3%, around the level the RBNZ currently considers neutral in nominal terms.
With so much monetary policy stimulus still flowing through from the prior easing cycle, where 325 basis points of cuts were delivered, the risk is the RBNZ may be forced to push rates into restrictive territory. That threat remains even with ample labour market slack still evident, underlining how uncomfortable the inflation backdrop could become if price pressures continue to build.
All eyes on May 13 survey
In particular, the RBNZ’s Survey of Expectations may prove pivotal in determining whether the Bank begins hiking rates as soon as May, making it one of the most important domestic releases still to come alongside upcoming labour market data. The next survey is due on 13 May, two weeks before the RBNZ’s next policy decision.
The key focus for markets is usually the two-year inflation expectations measure, widely seen as the horizon most relevant for monetary policy. Having accelerated noticeably in Q1 to 2.37%, a further lift would strengthen the case for an earlier tightening move.
Looking at rolling correlation coefficient scores across the past week, month and quarter, NZD/USD has not shown anywhere near as strong a relationship with energy prices as many other currencies and markets. Nor has it displayed a particularly firm linkage with rate differentials, at least against the US dollar, something that may in part reflect thinner liquidity than larger FX pairs.
Risk appetite is always a factor in the kiwi’s performance, but it is difficult to pin down exactly which macro regime the flightless bird currently finds itself in. With no clear dominant driver emerging, technicals come across as good a filter as any when assessing potential setups.
Ascending triangle in focus
Source: TradingView
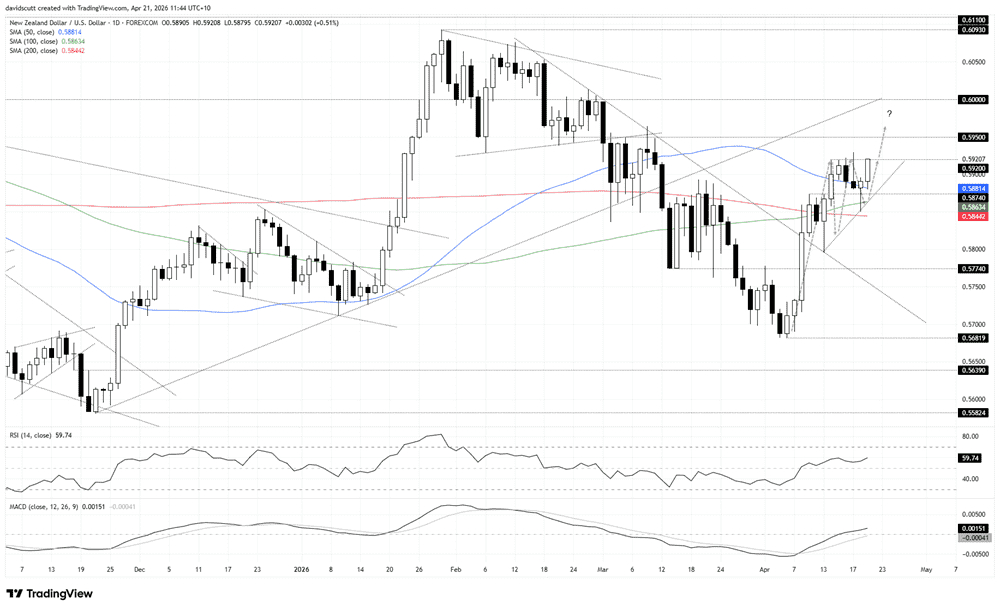
The trend break earlier this month has proven prescient in assessing directional risks, with NZD/USD pushing higher to reclaim all three major moving averages.
Right now, the pair sits in a structure resembling an ascending triangle, setting a series of higher lows while capped by resistance at .5920. That is the key topside level to watch, with NZD/USD testing it repeatedly over the past week, including earlier today. A break would bring .5950, .6000 and the January swing high at .6093 into view for bulls.
Adding to the breakout risk, if the current candle finishes around these levels it would complete a morning star reversal pattern, adding to the bullish signal delivered by Monday’s hammer candle.
On the downside, levels of note when considering trade entries and exits include the 50-day moving average at .5881, followed by .5874, .5800 and .5774.
Tilting directional risks higher near term, RSI (14) continues to trend higher and is now above 50. MACD is confirming the constructive signal, crossing above the signal line before pushing into positive territory. That favours long setups over shorts, although it does not eliminate downside setups should the signal mix or broader market conditions shift decisively in that direction.






