
- NZD/USD stuck between .5920 and the 200-day moving average
- NZD/JPY presses 94.30 triangle resistance, risks skewed higher
- BOJ may struggle to sound hawkish enough, weighing on yen
- Fed focus falls on Powell’s future
Summary
NZD/USD remains stuck in a holding pattern after recovering from the early Iran war selloff, while NZD/JPY is eyeing a bullish breakout with directional risks skewed higher as the pair compresses beneath triangle resistance ahead of the BOJ and Fed decisions. With the BOJ at risk of underdelivering against hawkish pricing and Fed focus on Powell’s future, both events may generate volatility, with Strait of Hormuz headlines a constant swing factor for sentiment.
Kiwi traders ready for BOJ, Fed
For Kiwi traders, the two major event risks over the next two days are the same ones dominating the broader FX landscape: the BOJ and Fed decisions, alongside the ongoing threat of fresh headlines tied to the Strait of Hormuz.
The BOJ is widely expected to hold rates, meaning the bigger risk may be that it does not come across hawkish enough to justify current market pricing for further tightening later this year, assuming it does not spring a genuine surprise and hike outright. If that were the outcome, Japanese yields may ease and yen crosses could catch a bid, creating upside risks for NZD/JPY.
The Fed is also expected to stand pat, leaving attention on Jerome Powell and whether he signals if he intends to remain on the Board as a governor when his term as chair expires on May 15 or leave the Fed altogether. If it is the latter, it may marginally tilt near-term directional risks for the US dollar lower given it could bring forward changes to the future voting makeup of the FOMC.
With those risks looming, the contrast in current chart structures is notable: NZD/USD continues to chop sideways awaiting a catalyst, while NZD/JPY looks at risk of breaking higher should the BOJ underwhelm or broader risk sentiment remain supported.
NZD/USD waits for catalyst
Source: TradingView
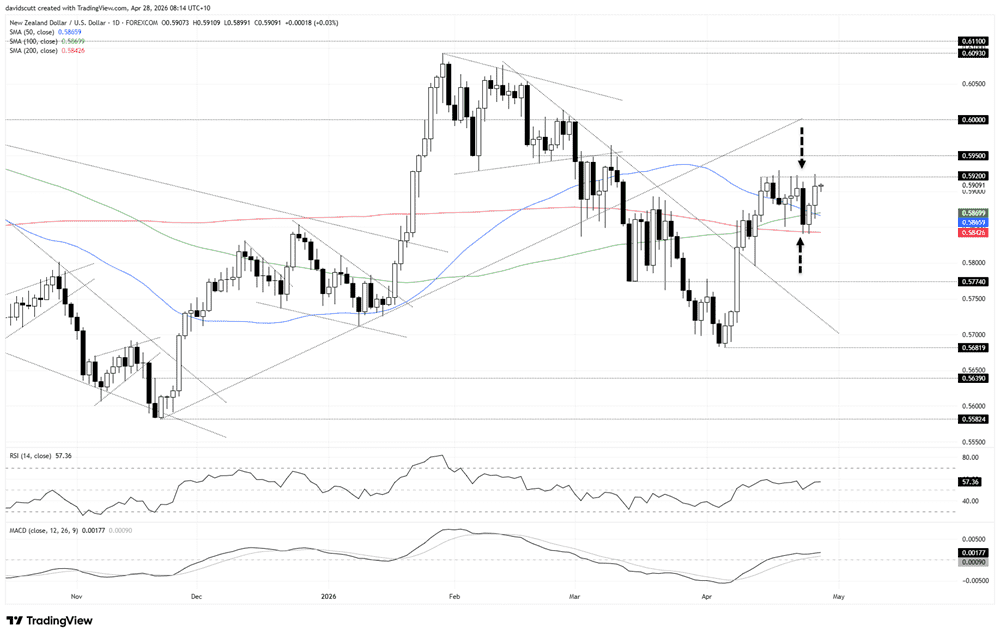
NZD/USD has settled into a range over the past fortnight, having recovered around half the losses seen in the early stages of the Iran war, attracting bids at the 200-day moving average on the downside and offers above .5920 resistance. That is the initial focal point for traders heading into a slew of major risk events that could influence the pair from both a rates and risk appetite perspective, including earnings results from several tech titans and the FOMC monetary policy decision on Wednesday.
While RSI (14) sits marginally above 50 and MACD has flipped into positive territory, having crossed above the signal line in early April, the overall message remains largely neutral when it comes to directional bias, even if momentum still sits marginally with the bulls.
Should we continue to see failures above .5920 resistance, shorts could be set with a tight stop above, targeting the 200-day moving average. And should the pair retrace back towards the 200-day moving average and bounce, it would also allow for longs to be set with a tight stop below, targeting .5920.
Either side of the prevailing sideways range, watch for offers at .5950 and .6000 on the topside should we eventually see a bullish breakout. A sustained break beneath the 200-day moving average would put .5774 in focus given it previously acted as support and resistance earlier this year. .5800, where the pair bounced strongly on April 13, is another level to watch in between.
NZD/JPY eyes upside break
Source: TradingView
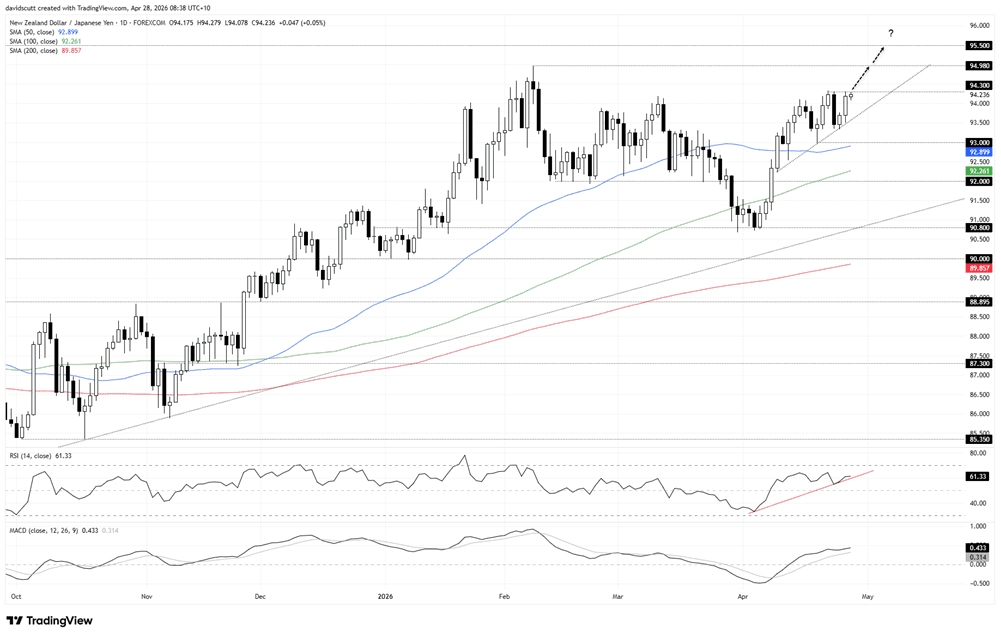
While NZD/USD is not providing any strong clues on where near-term directional risks may lie, it is a different story for NZD/JPY which continues to compress in an ascending triangle structure, pointing to the risk of an eventual bullish breakout and a retest of 94.98, the multi-year swing high set in February.
For now, the pair sits just beneath resistance at 94.30, making that the immediate overhead level to watch. A break and hold of 94.30, preferably with a back-test and bounce, would allow for longs to be set with a tight stop below for protection, targeting 94.98 initially and, beyond that, 95.50, a level that acted as support and resistance in mid-2024. Given where the triangle structure formed, achieving the latter target does not screen as a stretch, with a break above that level opening the door for a run towards 97.25 and the 2024 high of 99.02.
Of course, just because the pair finds itself coiling within a bullish structure does not mean a breakout will take place, meaning continued failures at 94.30 still allow for short setups to be considered. Shorts could be set beneath the level with a stop above, targeting either the April uptrend, confluence of the 50-day moving average with the low of 93.00 set on April 20, along with the 100-day moving average and 92.00 support.
The message from the oscillators is largely bullish when it comes to directional risks, with RSI (14) above 60 while MACD continues to trend higher in positive territory, having already crossed the signal line from below. There is some evidence of negative divergence between RSI and price, which raises a minor red flag, although it is not a definitive signal as yet.