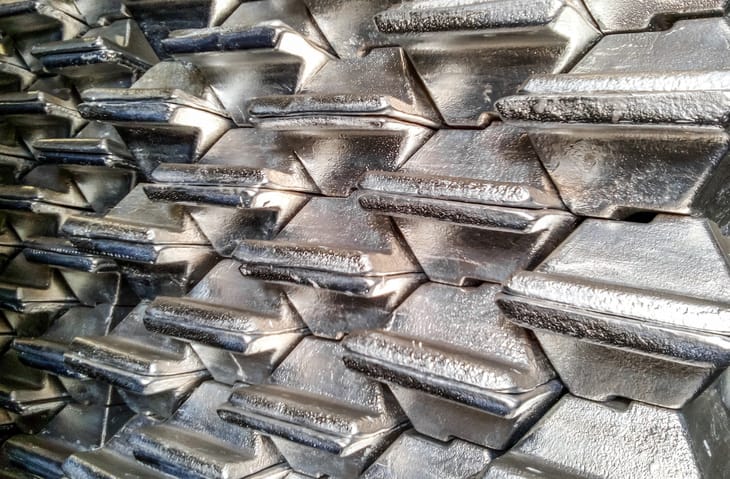

Sentiment has shifted quickly on Gold as the headlines from last week harped on the size of the sell-off. But after defending the $4100 level on Monday of last week, buyers came back and last week finished as a doji. So far this week, that indecision following the sell-off has turned into strength and buyers are making a statement move there.
Of interest was a formation I highlighted coming into the week as an ascending triangle. That’s a bullish breakout formation, with horizontal resistance and a series of higher lows. When combined with the weekly doji, this offered a degree of alignment from shorter-term bullish breakout potential and longer-term turn potential as taken from the doji on the weekly chart.
Silver futures aren’t quite as clean from the longer-term view but, similarly, last week was a change-of-pace in the selling as support showed at the 61.8% Fibonacci retracement of the recent rally. And so far this week, buyers are going to work which keeps the door open for larger bullish continuation scenarios.
Silver Weekly Price Chart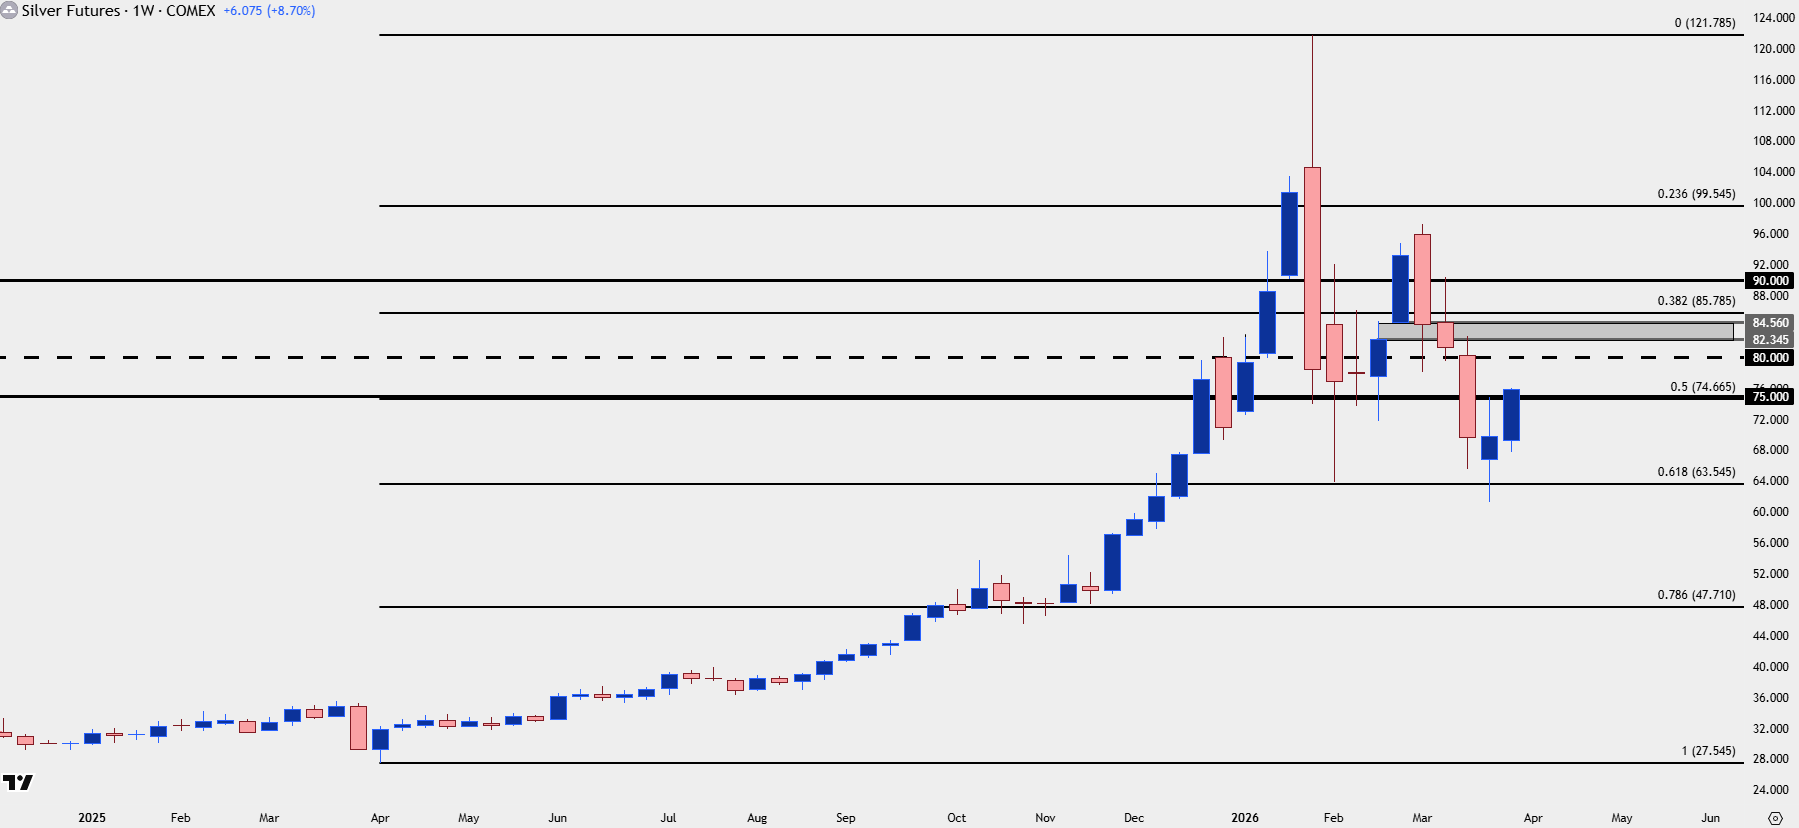
Chart prepared by James Stanley; data derived from Tradingview
Silver Shorter-Term
From that weekly chart you’ll probably notice a major line in the sand at the 75 handle. That price was support for four consecutive weeks before becoming resistance last week. And, shorter-term, that’s around where horizontal resistance plots for the ascending triangle formation, which is being tested through right now.
This opens up for the next resistance target at the 80-handle, after which a big price zone comes into play from 82.35-84.56.
Silver Four-Hour Price Chart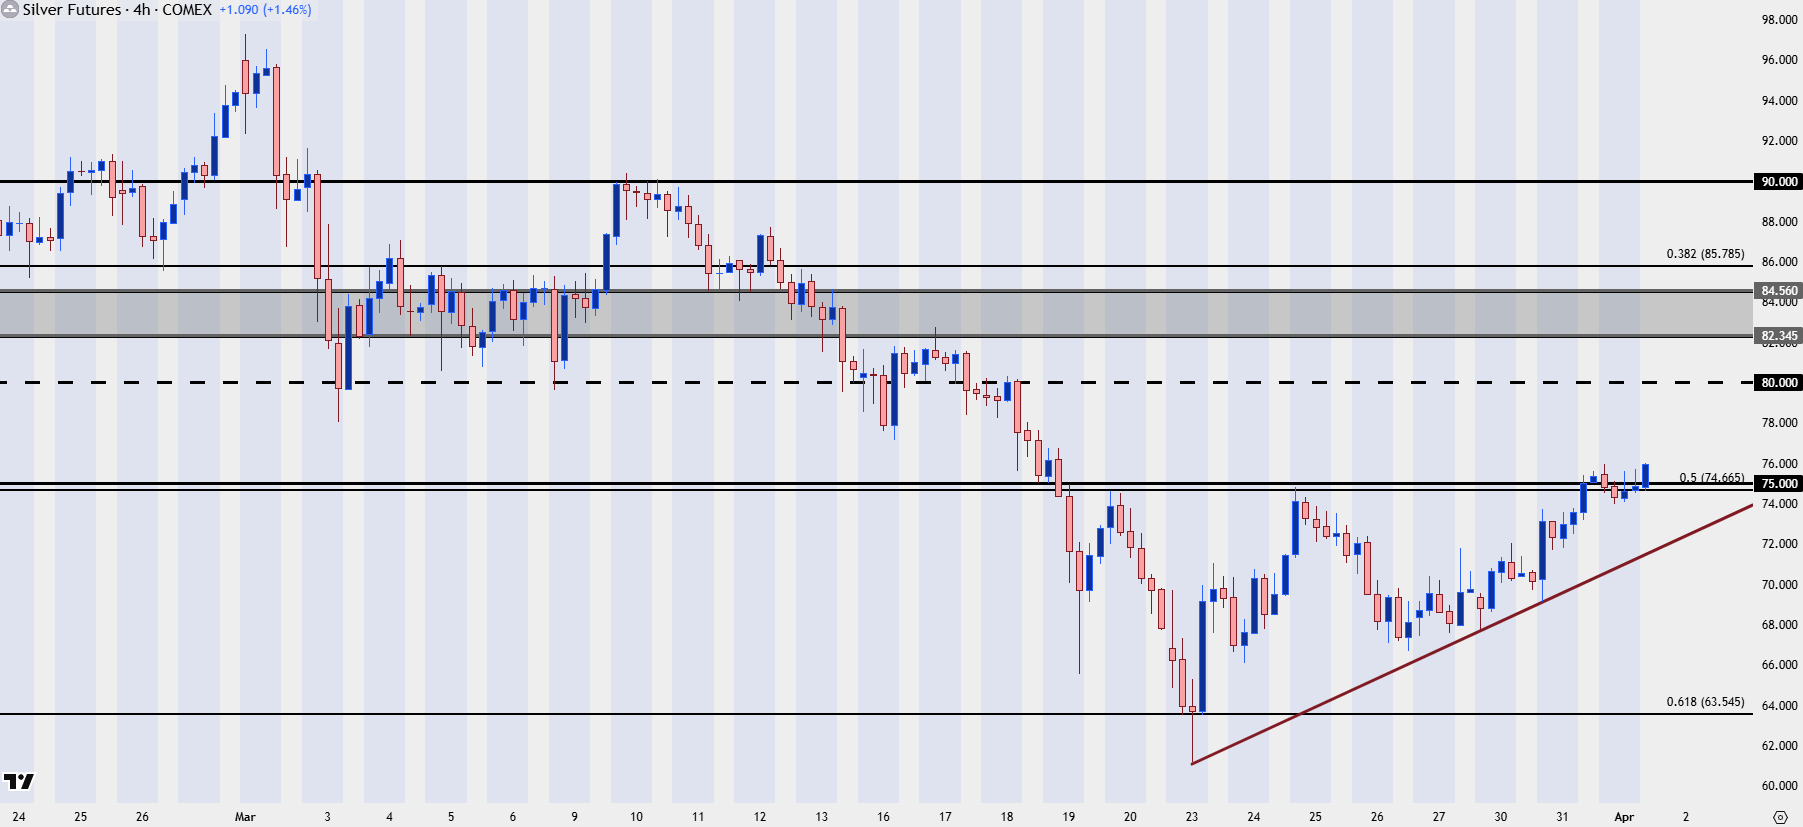
Chart prepared by James Stanley; data derived from Tradingview
--- written by James Stanley, Senior Market Analyst, Global Macro