


2025 delivered one of the clearest trading lessons of the decade: in a parabolic trend, overbought is not a sell signal. Shorting Gold without protection became one of the heaviest burdens traders carried this year, as the metal surged an unprecedented +64%, repeatedly defying historic RSI extremes and conventional momentum logic.
Gold opened 2025 near 2624, rallied almost 900 points into the 3500 high, consolidated for five months into a tight continuation structure, then launched another 900-point leg toward 4400. Trend followers and hedge traders navigating the new Trump policy cycle captured exponential upside. But for short sellers anchored to the idea of “overheating,” the relentless rise pushed portfolios to breaking points — not via reversals, but through brief consolidations that simply reset the uptrend.
This raised a deeper question for global investors: How high can Gold go? And what does that imply about confidence in today’s monetary and financial architecture?
Gold, US 500 Monthly Time Frame - Log Scale

Source: Trading view
For the first time in years, the positive correlation between Gold and US equity indices strengthened, sending both assets on synchronized exponential rises. Gold fulfilled a dual role:
- A safe haven during geopolitical shocks
- A liquidity beneficiary during risk-on expansion
A softer US Dollar, dovish policy expectations entering the Trump administration, and persistent central bank accumulation all reinforced the bullish cycle. This combination kept Gold almost exclusively in uptrend or consolidation mode, effectively suspending traditional overbought principles across 2025.
Will a proper correction emerge? Probably, with confirmation from major monthly technical levels.
Key Technical Structures and Lessons Ahead
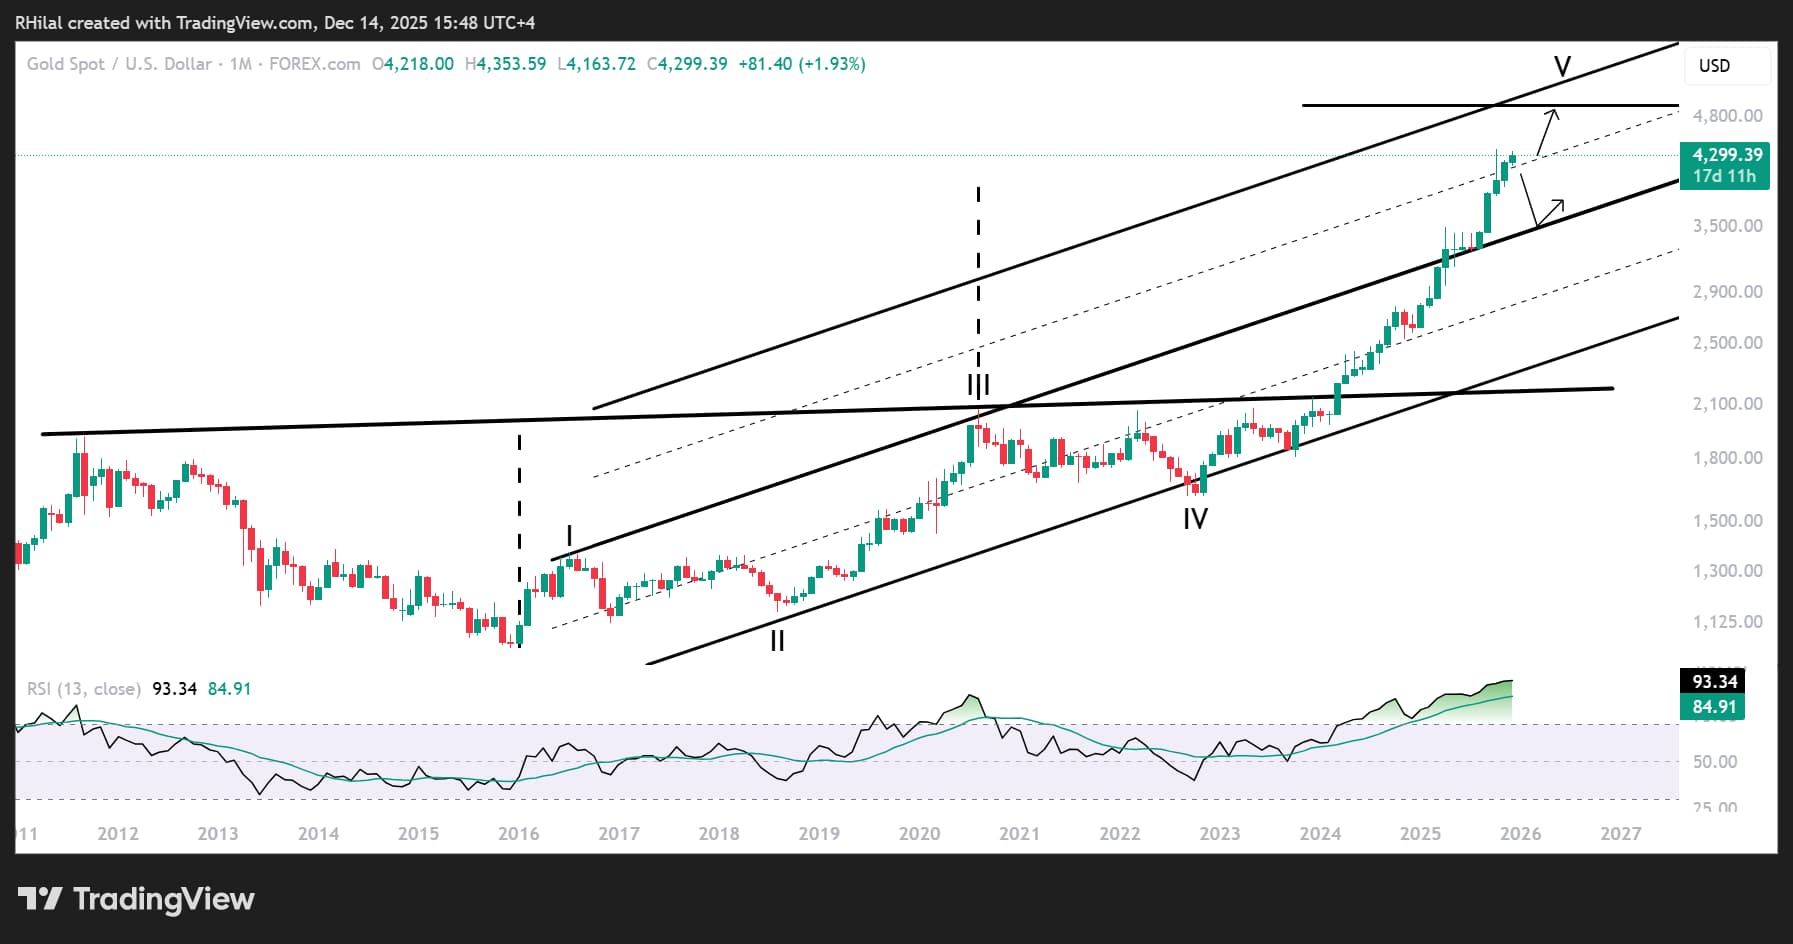
Gold Monthly Time Frame – Log Scale
Source: Trading view
Cup & Handle Completion
Gold’s nearly 4400 peak — accompanied by a record 93 RSI — aligns with the measured move of a decade-long cup and handle formation extending back to 2011. This marks a natural exhaustion and reaction zone.
Duplicated Channel Mid-Zone
Price has reached the mid-point of a duplicated channel framing Gold’s primary structure from 2016 to 2025. Historically, mid-zones act as equilibrium areas where markets pause, consolidate, or retrace before the next structural move.
But as the saying goes, the trend is your friend until a confirmed reversal emerges. As long as Gold continues to break through psychological and structural resistance levels, the broader bullish framework remains intact.
Market consensus, including major US banks, increasingly points toward a $5,000 target. This scenario becomes viable if Gold delivers a sustained monthly close above the 4,400 breakout zone, which would open the path toward the upper boundary of the duplicated long-term channel near the 5k region.
However, Gold is currently positioned near a neutral mid-channel zone, where trend hesitation or corrective phases often develop. A drawdown toward the 3700–3500 channel support area remains a realistic risk before the next leg higher. Such a move would not invalidate the primary uptrend but would require careful monitoring of trend shifts and key breakouts to avoid bull traps, bear traps, and prolonged consolidation structures. For now, 3900 stands as the pivotal support level; losing it would be the first meaningful indication of deeper corrective pressure.
Written by Razan Hilal, CMT
Follow on X: @Rh_waves






