


Weekly Technical Trade Levels on USD Majors, Commodities & Stocks
- Technical trade setups we are tracking into the start of the week on the USD Majors, commodities, bitcoin, and equity indices.
- Event risk on tap: Australia CPI, President Trump’s State of the Union address & US PPI
- Next Weekly Strategy Webinar: Monday, March 2 at 8:30am ET
- Review the latest Video Updates or Stream Live on my YouTube playlist
In this webinar we take an in-depth look at the technical trade levels for the US Dollar (DXY), Euro (EUR/USD), British Pound (GBP/USD), Australian Dollar (AUD/USD), Canadian Dollar (USD/CAD), Japanese Yen (USD/JPY), Swiss Franc (USD/CHF), Gold (XAU/USD), Crude Oil (WTI), and Bitcoin (BTC/USD), and S&P 500 (SPX500), Nasdaq (NDX), and Dow Jones (DJI). These are the levels that matter on the technical charts into the weekly open.
US Dollar Price Chart – USD 240min (DXY)
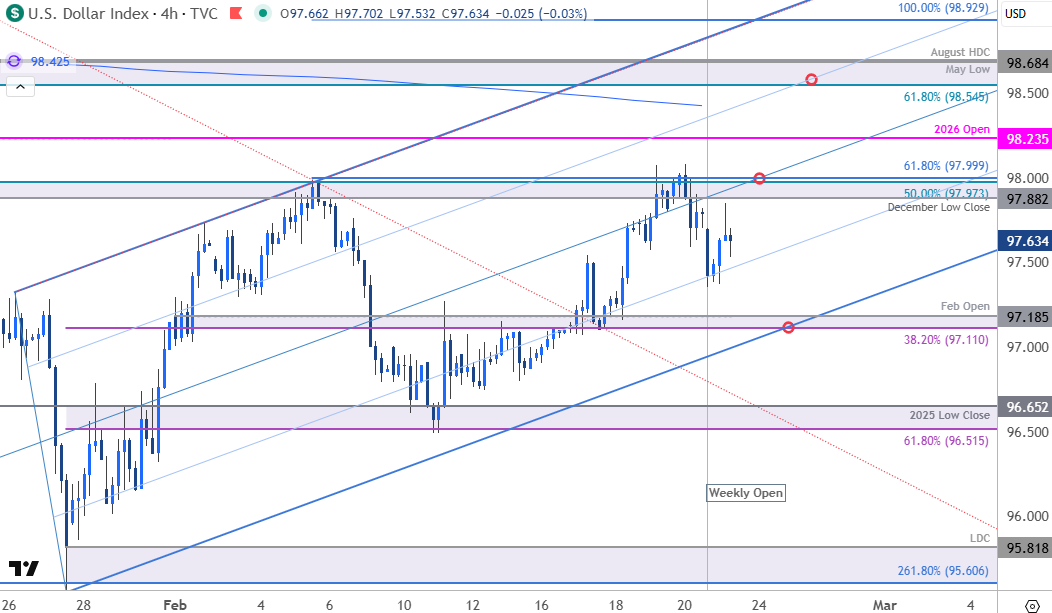
Chart Prepared by Michael Boutros, Sr. Technical Strategist; DXY on TradingView
Notes: The US Dollar Index exhausted into confluent resistance last week at 97.88/99- a region defined by the December low close, the 50% retracement of the November decline, the February opening-range high and the 61.8% extension of the late-January advance. A break / daily close above this threshold is needed to fuel the next leg of the advance toward subsequent resistance objectives at the yearly open at 98.24. The next major technical consideration is eyed at the 61.8% retracement, the May low, and the August high-day close (HDC) at 98.55/68- look for a larger reaction there IF reached.
Support rests with the 38.2% retracement of the January rally and the objective monthly open at 97.11/19. Note that the lower parallel converges on this threshold over the next few days and losses below this slope would invalidate the multi-week uptrend. Ultimately, a break / close below the 61.8% retracement and the 2025 low-close at 96.52/65 would be needed to suggest a more significant high is in place and a threaten resumption of the broader downtrend in the Dollar.
Bottom line: The February opening-range remains intact heading into the close of the month with the US Dollar trading just below resistance. From a trading standpoint, losses would need to be limited to 97.11 IF price is heading higher on this stretch with a close above 98 needed to fuel the next leg of the advance.
Keep in mind the State of the Union address to congress is on tap tomorrow night with the Produce Price Index (PPI) slated on Friday. Traders will be looking for clues as to the administration’s direction on tariffs after last week’s supreme court decision. Stay nimble into the monthly cross and watch the weekly closes here for guidance. Review my latest US Dollar Forecast for a closer look at the longer-term DXY technical trade levels.

Oil Price Chart – 240min
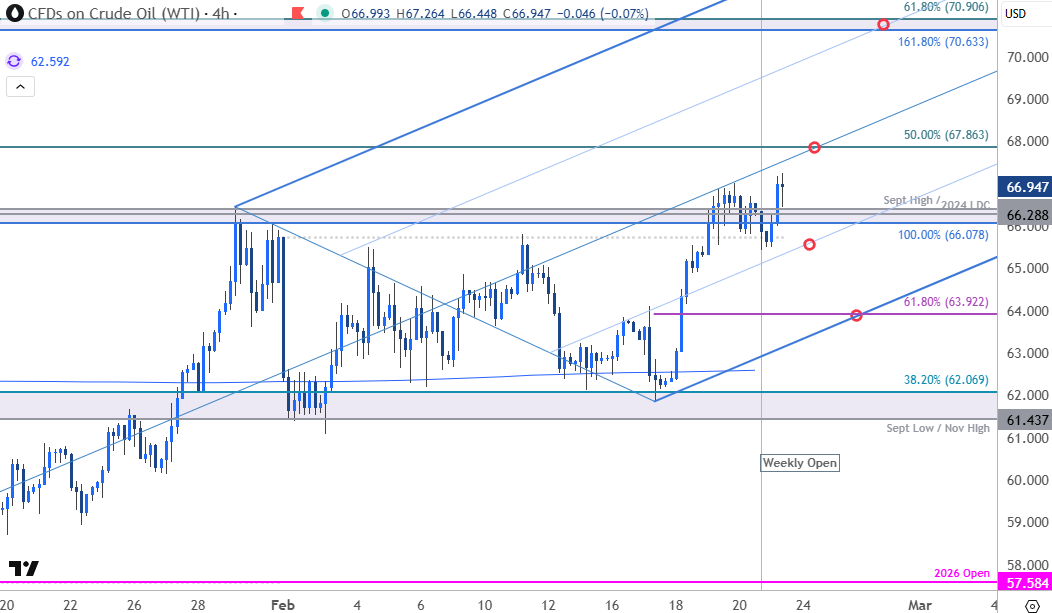
Chart Prepared by Michael Boutros, Technical Strategist; WTI on TradingView
Note: Are oil prices breaking out here? A breakout of the February opening-range last week does threaten a late-month high, but the momentum profile here looks vulnerable. Monthly open support rests at 65.74- losses below this level would invalidate the immediate breakout bias with near-term bullish invalidation now set to the 61.8% retracement of the recent advance near 63.92. Note that the lower parallel converges on this zone over the next few days and losses below this level would be needed to suggest a more significant near-term high is in place.
Initial resistance is eyed near 67.86 with the next major technical consideration eyed at 70.63/91- a region defined by the 1.618% extension of the December advance and the 61.8% retracement of 2025 decline. Look for a larger reaction there IF reached.
Bottom line: WTI is testing pivotal resistance here at the monthly range high. From a trading standpoint, losses would need to be limited to 63.92 IF oil is heading higher on this stretch with a close above 67.86 needed to fuel the next major leg of the advance. Keep an eye on the headlines this week with regards to the Iran conflict. If war breaks out, the focus will be on possible transit interruptions in the Strait of Hormuz where roughly 20% of global oil passes through.
Economic Calendar – Key Data Releases
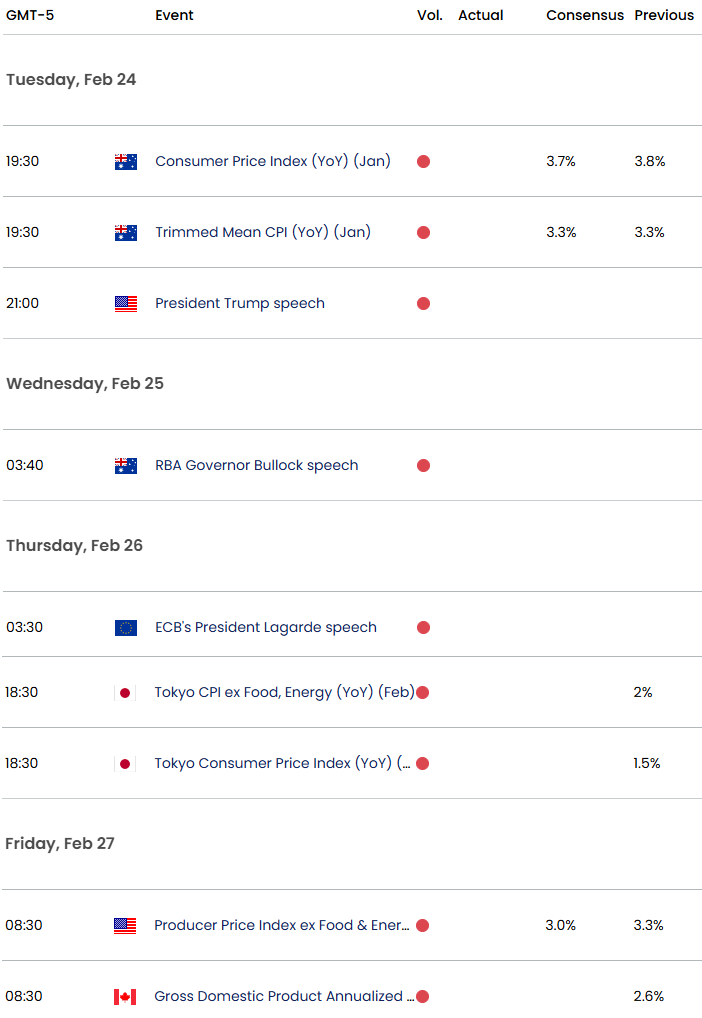
Economic Calendar - latest economic developments and upcoming event risk.
--- Written by Michael Boutros, Senior Technical Strategist
Follow Michael on X @MBForex






