
US Dollar Technical Outlook: DXY Multi-Timeframe Analysis
The U.S. dollar index has dropped more than 3% off its yearly high, breaking below its 200 day moving average and the August monthly opening range. Michael Boutros, StoneX Media Senior Market Analyst, walks through the U.S. dollar index on the weekly, daily and four hour charts. Core PCE, the Federal Reserve's preferred inflation gauge, is expected to tick higher on the month while the annual rate holds steady, and markets are still pricing a majority chance of a hold at the September meeting. Commentary from the Jackson Hole symposium closes the week and carries the same rate path risk as the data. Boutros also covers the weekly opening range and what would nullify the monthly range break.
This content was created by an affiliate of FOREX.com and represents the views and opinions of the author/speakers, not the views and opinions of Forex.com, StoneX Group Inc., or its subsidiaries. The content has not been independently reviewed by FOREX.com.

US Economic Data Releases
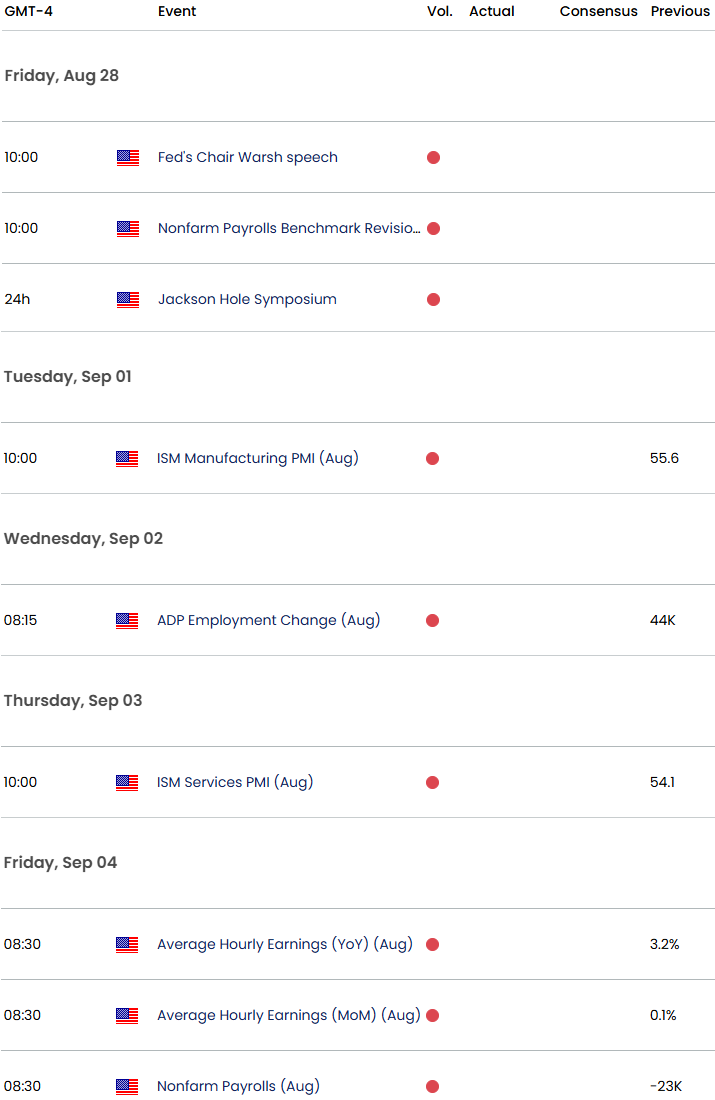
Economic Calendar - latest economic developments and upcoming event risk.
Active Short-term Technical Charts
- Australian Dollar Short-term Outlook: AUD/USD Breakout Extends to 10-Week Highs
- British Pound Short-term Outlook: GBP/USD Bulls Confront Resistance at Three-Month Highs
- Gold Price Short-term Outlook: XAU/USD Breakout Faces a Defining Test
- US Dollar Short-term Outlook: USD Correction Pressures Pivotal Support
- Euro Short-term Outlook: EUR/USD Breakout Risk Builds Into Month-End
- Swiss Franc Short-term Outlook: USD/CHF Rally Presses Yearly Trend Resistance
- Japanese Yen Short-term Outlook: USD/JPY Defends the Uptrend as the Range Tightens
Written by Michael Boutros, Senior Technical Strategist
Follow Michael on X @MBForex