
CAD crosses enter a pivotal 24-hour window with BoC and FOMC meetings lined up. Volatility is already elevated in USD/CAD, and both EUR/CAD and AUD/CAD are probing key technical levels that could define the next major swing.
Below is the full technical breakdown for USD/CAD, EUR/CAD and AUD/CAD as traders position for the twin risks of the FOMC and BoC meetings.
View related analysis:
- Gold Grinds Unconvincingly Higher, USD Holds Ground Into FOMC
- Japanese Yen Weakness Lifts USD/JPY and EUR/JPY while Nikkei Holds 50k
- S&P 500 Seasonality: How Santa's Rally Across Wall Street Stacks Up
- ASX 200 Market Outlook: All Sectors See Red After Hawkish RBA Hold
- Dead Cat Bounce Explained: How False Rallies Form in Downtrends
CAD Crosses: RBA Hold, Technical Setups into FOMC and BoC
Reserve Bank of Australia (RBA) Signals Hawkish Tilt as AUD Outperforms
The Australian dollar was the strongest major currency on Monday after the RBA delivered a hawkish hold. The statement noted that inflation risks have tilted to the upside, and Governor Bullock said the Board will have a clearer read on those risks by the February meeting — placing extra emphasis on the Q4 CPI figures due on 26 January.
While a hike was not considered, the conditions for one were discussed. The RBA is clearly preparing investors for the possibility of a rate increase, with incoming data determining the timing on a meeting-by-meeting basis.
Bank of Canada (BOC) up Next
It seems inevitable that the BOC will be the next central bank to deliver a hawkish hold. Strong employment, sticky inflation and better than expected growth also opens the door for potential hikes. The question for traders now is whether this has already been priced in, or whether the BOC deliver a more hawkish tone to justify an extension of gains for the Canadian dollar we’ve already seen these past two weeks.
Final FOMC Meeting Also Up for Grabs
Not wanting to miss out, the Fed could be the third central bank to deliver a hawkish tone, though they're expected to deliver a 25bp cut hold at their final FOMC meeting of the year. Updated staff projections will also be released, so traders will keep a close eye on the dot plot and interest rate forecast to see how many cuts are lined up for 2026. Bank of America estimate two 25bp cuts, but I am with Goldman Sachs who anticipate just one cut. But given the recent trend of cuts turning to hikes, the Fed are trapped between concerns over rising inflation and pressure from President Trump who clearly wants multiple cuts.

USD/CAD Technical Analysis: US Dollar vs Canadian Dollar
Canadian dollar implied vols spike
As expected, overnight implied volatility in USD/CAD has surged ahead of the BoC and FOMC meetings. We’re also seeing 1-week implied volatility trade at a premium to the 1-month tenor, with both drifting higher.
This sets the stage for two-way price swings around the central bank events, but note that options positioning leans mildly bearish for USD/CAD. Both the 1-week and 1-month risk reversals are trending lower, signalling stronger demand for puts than calls.

Chart analysis by Matt Simpson - data source: LSEG
USD/CAD Bounce Risk Before Bear Trend Potentially Resumes
The daily chart shows US–Canada 2-year yield differentials holding near cycle lows, implying any USD/CAD bounce may be short-lived. Still, with the pair already down 2.3% in two weeks and stabilising above support, a short-term rebound is plausible before the broader downtrend resumes.
A bullish divergence has formed on the RSI(2) within oversold territory, and price is holding above the September VPOC near 1.38 and the monthly S2 pivot.
Key resistance sits around 1.390 via the monthly S1 pivot and 1.3880, followed by the 200-day EMA (1.3919), the November low (1.3938), and the weekly VPOC (1.3962). These levels offer potential fade zones should sellers look to re-engage with the dominant bearish trend after an anticipated bounce.
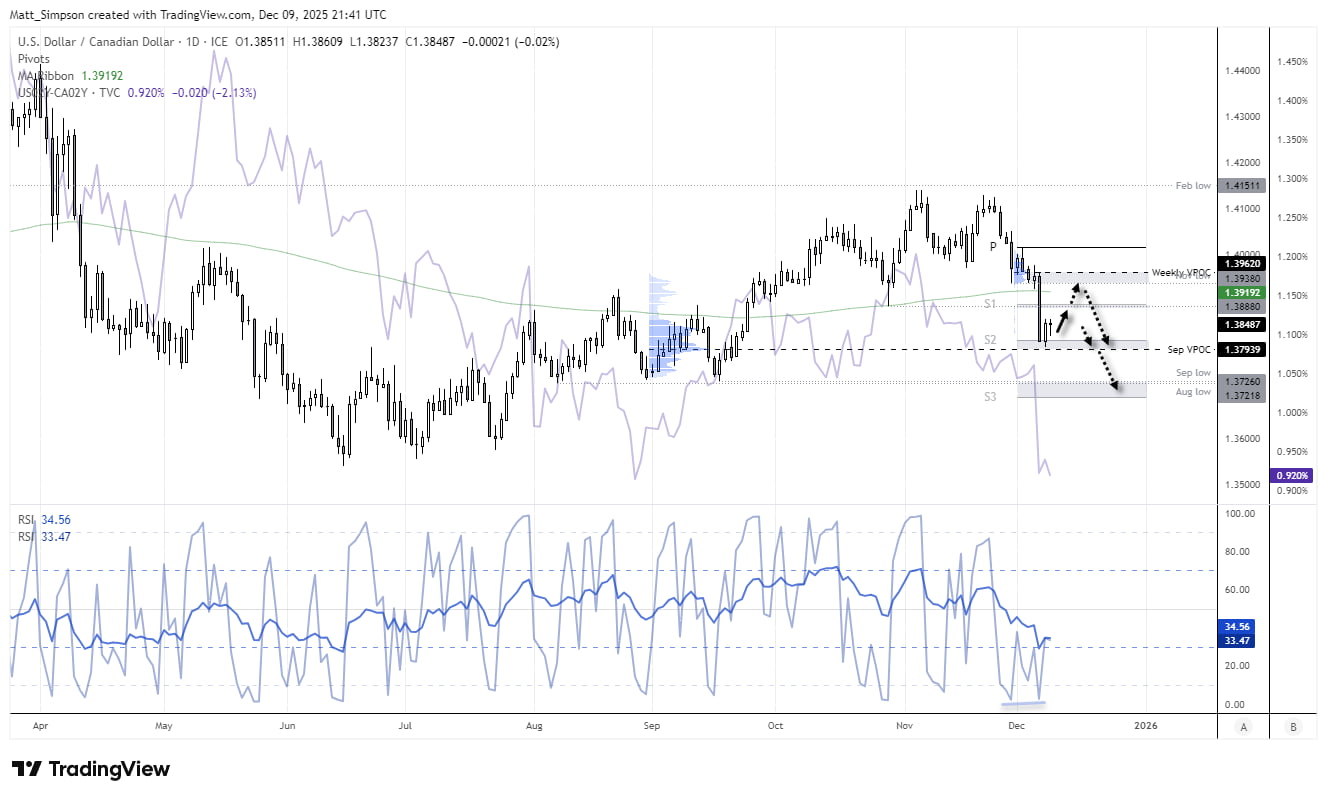
Chart analysis by Matt Simpson - data source: TradingView USD/CAD
AUD/CAD Technical Analysis: Australian Dollar vs Canadian Dollar
Patience may be needed on AUD/CAD, with both the RBA and BoC likely to have delivered hawkish holds by this time tomorrow. That keeps both currencies vulnerable to bouts of strength, leaving the cross confined to its broader range — but also well suited to a range-trading approach while key levels remain intact.
The weekly chart shows an elongated bearish hammer following a false break of the October high. Prices are drifting higher into last week’s upper wick, which raises the risk of another false push higher before a dip.
On the daily chart, AUD/CAD has risen for a second session, but resistance is close by. The monthly R1 pivot sits at 0.9243, aligned with the October high at 0.9242. Bears may look to fade rallies into this zone, targeting at least a mean-reversion move toward the monthly pivot at 0.9135. Should the BoC adopt a meaningfully more hawkish tone than the RBA, a deeper downside move cannot be ruled out.
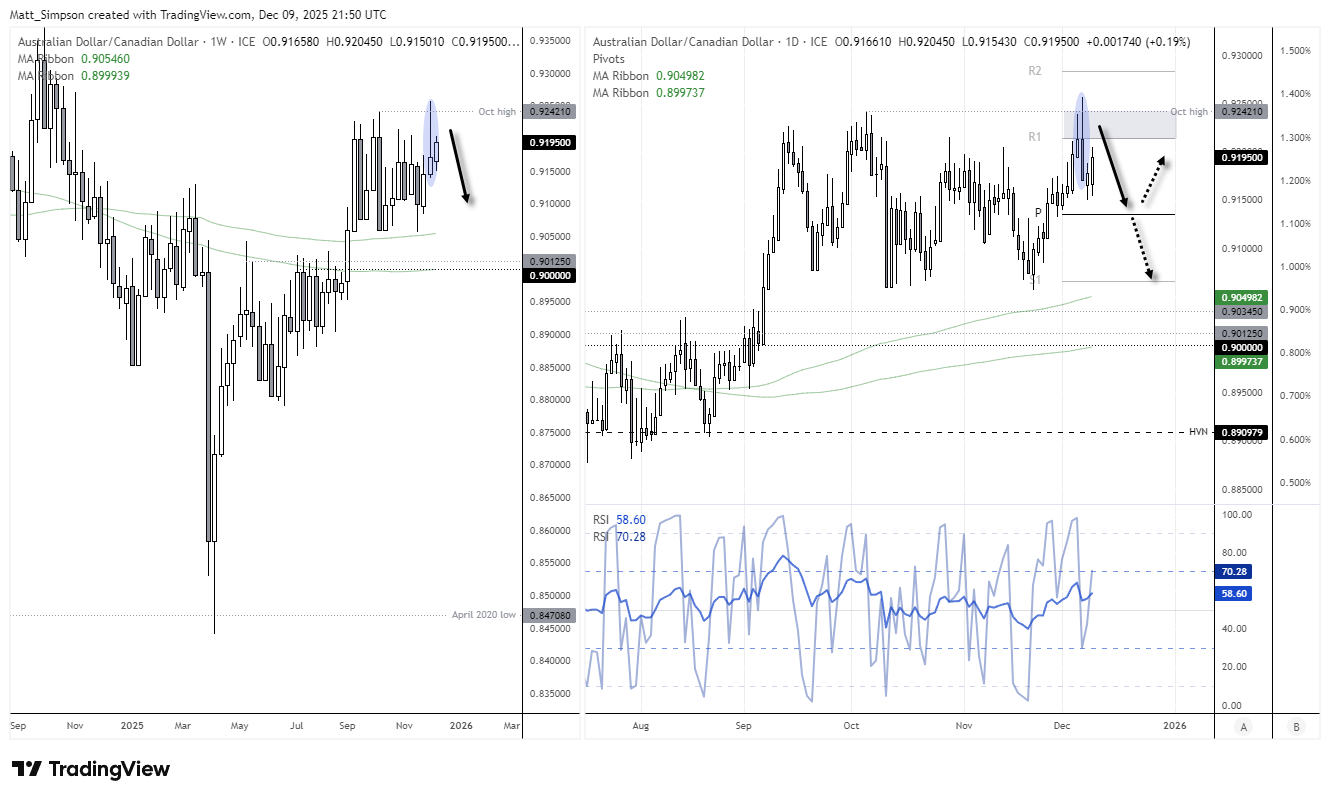
Chart analysis by Matt Simpson - source: TradingView AUD/CAD

EUR/CAD Technical Analysis: Euro vs Canadian Dollar
EUR/CAD has carved out an interesting setup on the daily chart. Friday’s decisive close below trend support has held, with the cross now trading in a tight range near the lows. Price continues to respect both the broken trendline and the October low as resistance. This behaviour suggests the potential for a dead-cat bounce — a small, corrective lift that precedes another leg lower once consolidation breaks.
Support clusters sit around the 1.60 handle and the 200-day moving averages, offering logical downside targets if bearish momentum extends.
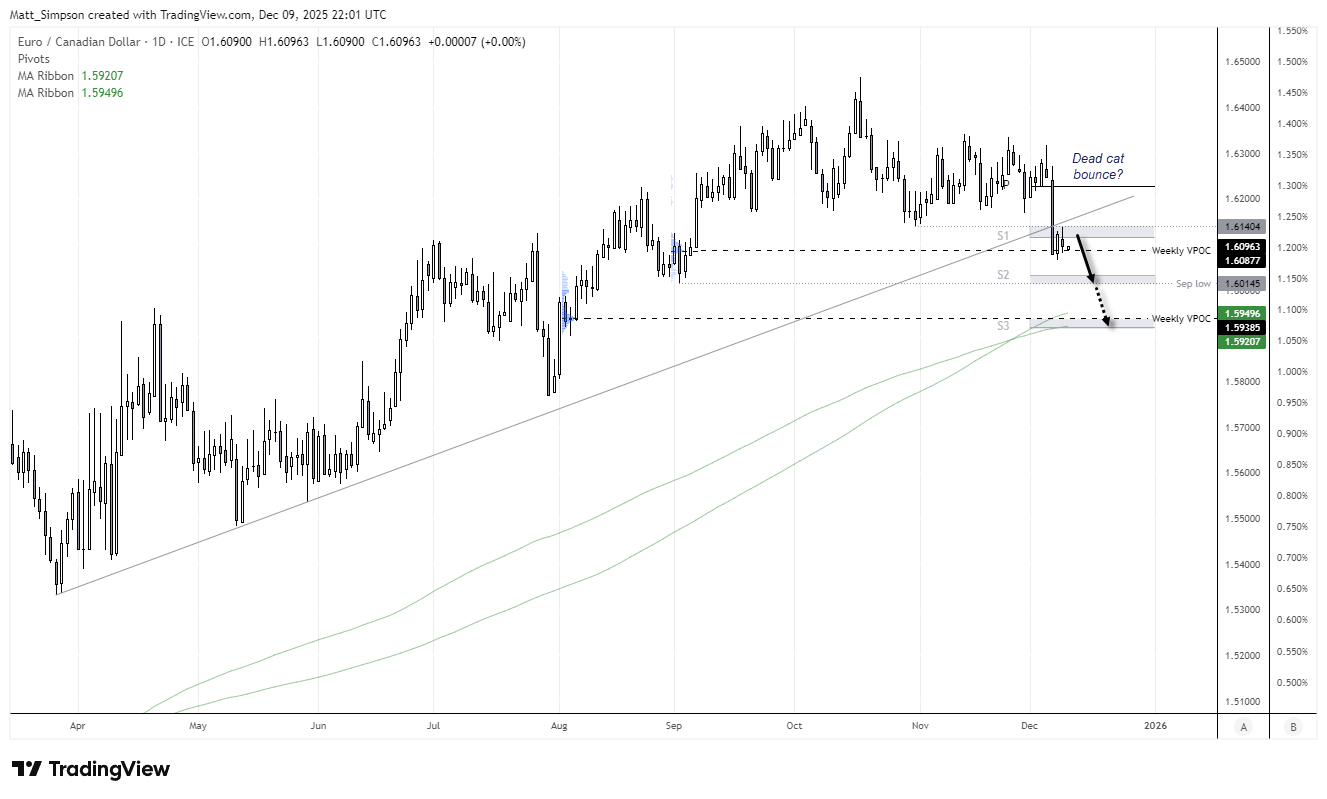
Chart analysis by Matt Simpson - source: TradingView EUR/CAD
View the full economic calendar
-- Written by Matt Simpson
Follow Matt on Twitter @cLeverEdge