
If you’d go back a year and tell traders that the US Dollar would top just two weeks into the New Year, and then embark on a dizzying bearish trend, few would probably believe you. As we came into 2025 the overwhelming show of sentiment was that a parity test was due in EUR/USD, and that made sense, given the massive sell-off that enveloped the pair in Q4 of last year.
But matters can get strange around quarterly closes, and yearly closes, as well, and 2025 was evidence of that as the USD topped and EUR/USD bottomed just two weeks into 25 trade, and after a bout of digestion in February counter-trends took over in March and led the way into the end of Q2.
Since then, however, both EUR/USD and DXY have been rather stuck, with EUR/USD continuing to chew at a big area of longer-term Fibonacci resistance and DXY actually showing two green quarterly candles, even with the Fed going into rate cuts and President Trump set to nominate a Fed Chair that will probably be sympathetic to his rate cut hopes.
Matters may not be so simple, however, as the opacity produced by the government shutdown in late 2025 obscures a few significant data points. With both employment and inflation seemingly open to rate cut potential, the big question in 2026 is whether that continues – or – if we see inflation rise to the point where the Fed has to scale back on those rate cut hopes. After all, it’s tough to have a strong labor market and robust growth while also having ‘perfect inflation,’ and further, if we do see the Fed cutting rates that doesn’t necessarily ensure that long-term rates, and mortgage rates, will follow. Like we saw in 2024 Treasury markets are very much looking beyond short-term Fed policy and considering the impact to longer-term inflation forecasts. And if we do have a high growth backdrop with softening rates, then, reasonably, inflation expectations can increase down the road; and then holding long-term bonds makes less sense as that higher inflation further erodes real returns.
In this article I want to look at a few macro markets while also considering the possible range of outcomes as we trade into the New Year.
The US Dollar
One of the more surprising factors to me this year was just how heavy handed Trump was around performance in the US Dollar. In his first term, he was considered an outlier in that he would actually opine about Fed policy and I think the expectation for his second term was that he would similarly remark, and perhaps even criticize, but not to intersect to the degree that he has. One of the more noteworthy incidents of the year was when President Trump toured the new Federal Reserve building in Washington D.C., accompanied by Jerome Powell. The Q&A at the end of that meeting was full of interesting exchanges and while somewhat humorous, it was considerably lighter than some of the other comments that were sent towards the direction of Powell during the year.
Trump had a quote in July that stuck out to me: "So when we have a strong dollar, one thing happens: It sounds good. But you don't do any tourism. You can't sell tractors, you can't sell trucks, you can't sell anything." He then went on to say: "It is good for inflation, that's about it."
That, combined with the constant posturing around the next Fed Chair, with Trump going so far as to say a willingness to cut rates would be a ‘litmus test’ for whoever he nominates, and it’s clear that Trump wants to push a weak US Dollar in order to help boost American exports.
And while lower Fed rates can possibly lead to such a scenario, there’s also a chance that it backfires, similar to what showed in Q4 of 2024, when the US Dollar rallied and Treasury rates jumped even as the Fed was cutting. The big item there was inflation, and with inflation already above target as the Fed was reducing rates, the prospect of holding long-term debt which would yield less on a real basis was even less attractive.
For 2026, that’s the big risk – that inflation pushes higher and continues to grow to the point that the Fed has little choice but to stop rate cuts and, possibly, look at rate hikes instead. Given mid-term elections in November this could have large consequences for President Trump, as losing a Republican majority could complicate his final two years in office.
For the Greenback, higher US inflation could have a similar impact as rate cuts in Q4 of 2024, but the ultimate driver as to whether a bullish reversal can take over or whether bears are able to drive down towards the 92-handle will probably rest with another market that we’ll look at next.
US Dollar Monthly Price Chart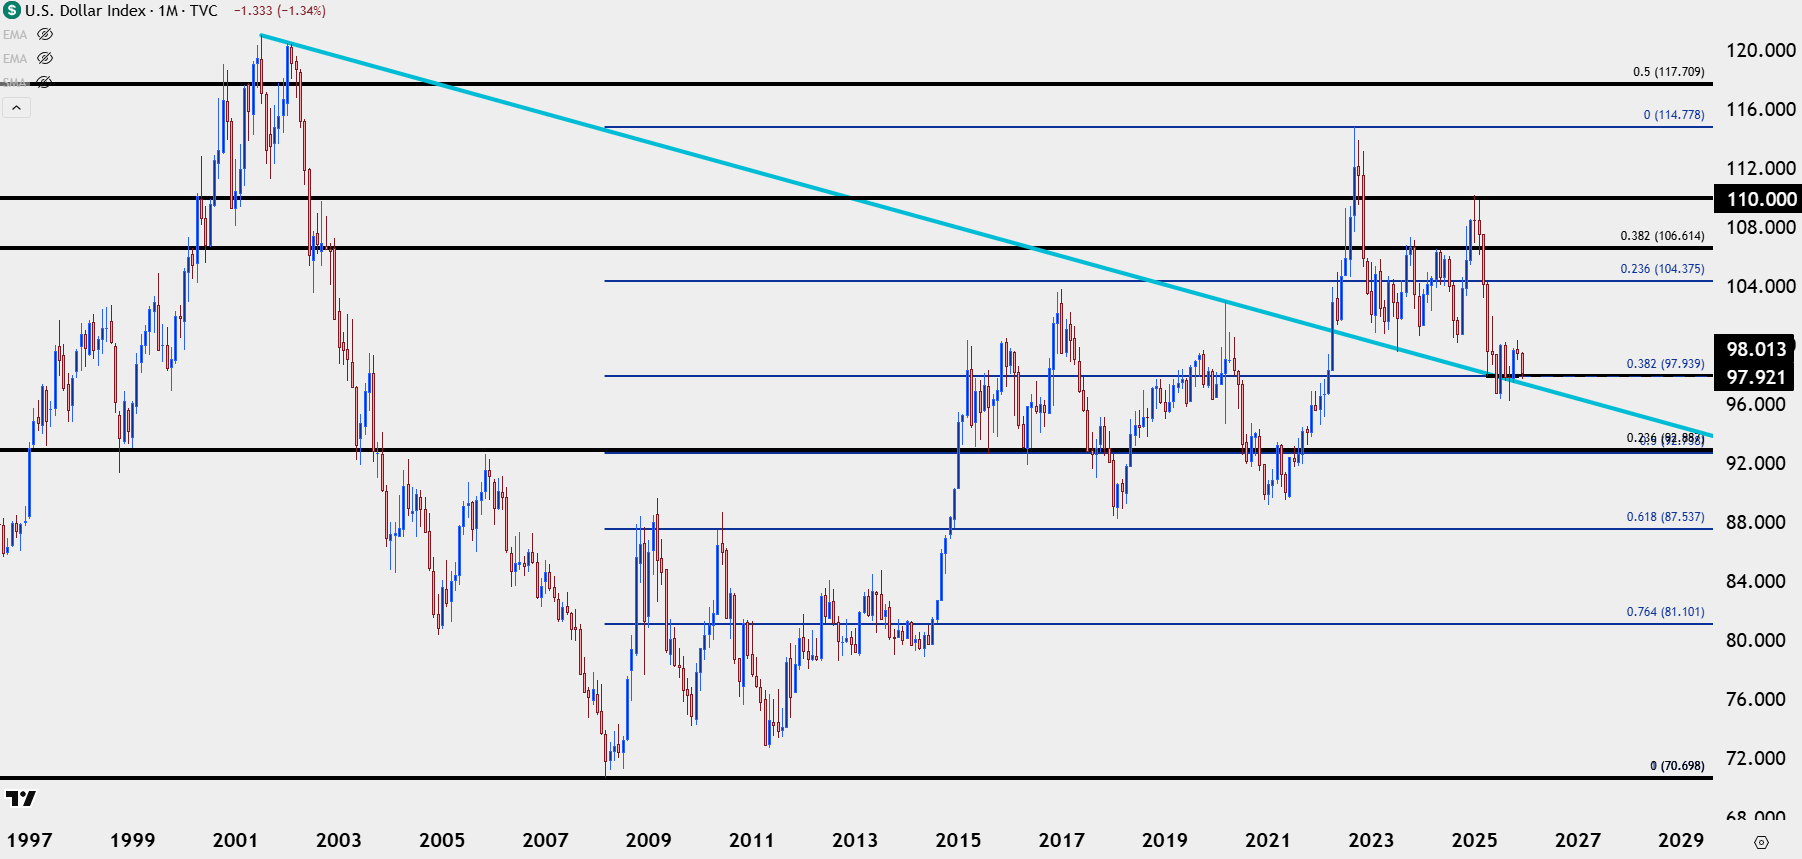
Chart prepared by James Stanley; data derived from Tradingview
EUR/USD
Everything has a cost to the trader: Ego, views, opinions, everything. And this was on full display in EUR/USD in 2025 as it seemed almost a foregone conclusion that a parity test was incoming for the major pair.
But it’s right around that time, when market participants seem to hold an almost unanimous view, when things get most opportunistic.
Like the USD, EUR/USD set a low on January 13th. This happened to print right at a key Fibonacci level around the 1.0200 handle. And the reversal wasn’t instant, as the pair spent almost the entire month of February grinding in an ascending triangle that, eventually, broke out in a very big way in March.

That then led to another few months of strength, with EUR/USD finding resistance at the 78.6% retracement of that same Fibonacci setup in late H1 trade. Interestingly I used this Fibonacci backdrop in an evergreen article on the topic back in February and as we can see almost a year later, the levels produced by that retracement continue to loom large.
The pair has been grinding back and forth with little progress to show in either direction for the past six months. Given the heavy 57.6% allocation of the Euro in the DXY quote, if we are to see a trend in either market next year, it’ll probably need at least some participation from the other. This is highly relevant to the USD as the currency has largely remained stalled around support to go along with the EUR/USD stall around resistance.
The big question around the Euro is whether the economy an support higher spot rates, and if we do see a 1.2000 print in the EUR/USD pair or beyond, what will the ramifications of that be. Will it erode growth and inflation to the point where the ECB has to re-open the door to rate cuts?
EUR/USD Weekly Price Chart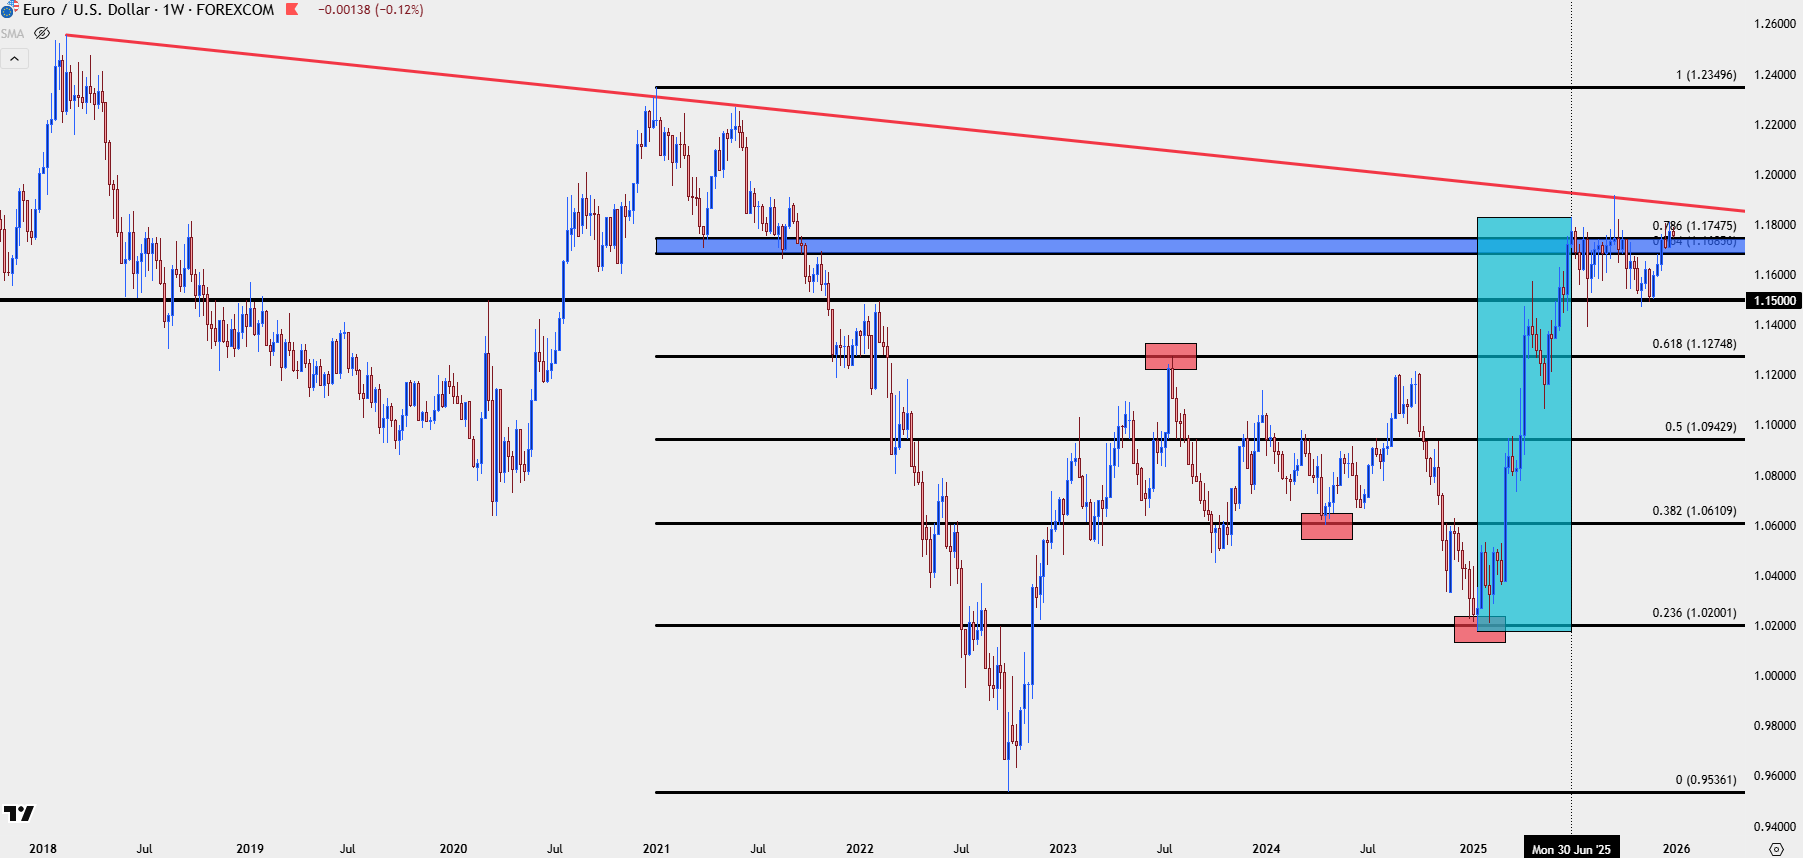
Chart prepared by James Stanley; data derived from Tradingview
USD/JPY
The Yen is a massive point of interest in 2026 because there’s now a bit of friction between the Bank of Japan and the recently elected Japanese government. There’s also the fear of what happens if Japanese yields continue to climb, and whether or not the Bank of Japan can refrain from hiking rates enough to stem inflationary pressure.
Japanese Prime Minister Sanae Takaichi has previously called BoJ rate hikes ‘stupid,’ and for an aging population that’s struggled with deflation and disinflation multiple times in the past 40 years, a pro-growth agenda probably sounded attractive to Japanese voters.
But, like we saw in the above scenario around US rates in Q4 of 2024, Central Bank policy doesn’t necessarily dictate market participants’ reactions, and a chart of Japanese 10-year yields shows a massive spike, particularly in December as the BoJ finally came to the table with a rate hike.
Japanese Government Bond 10-Year Yields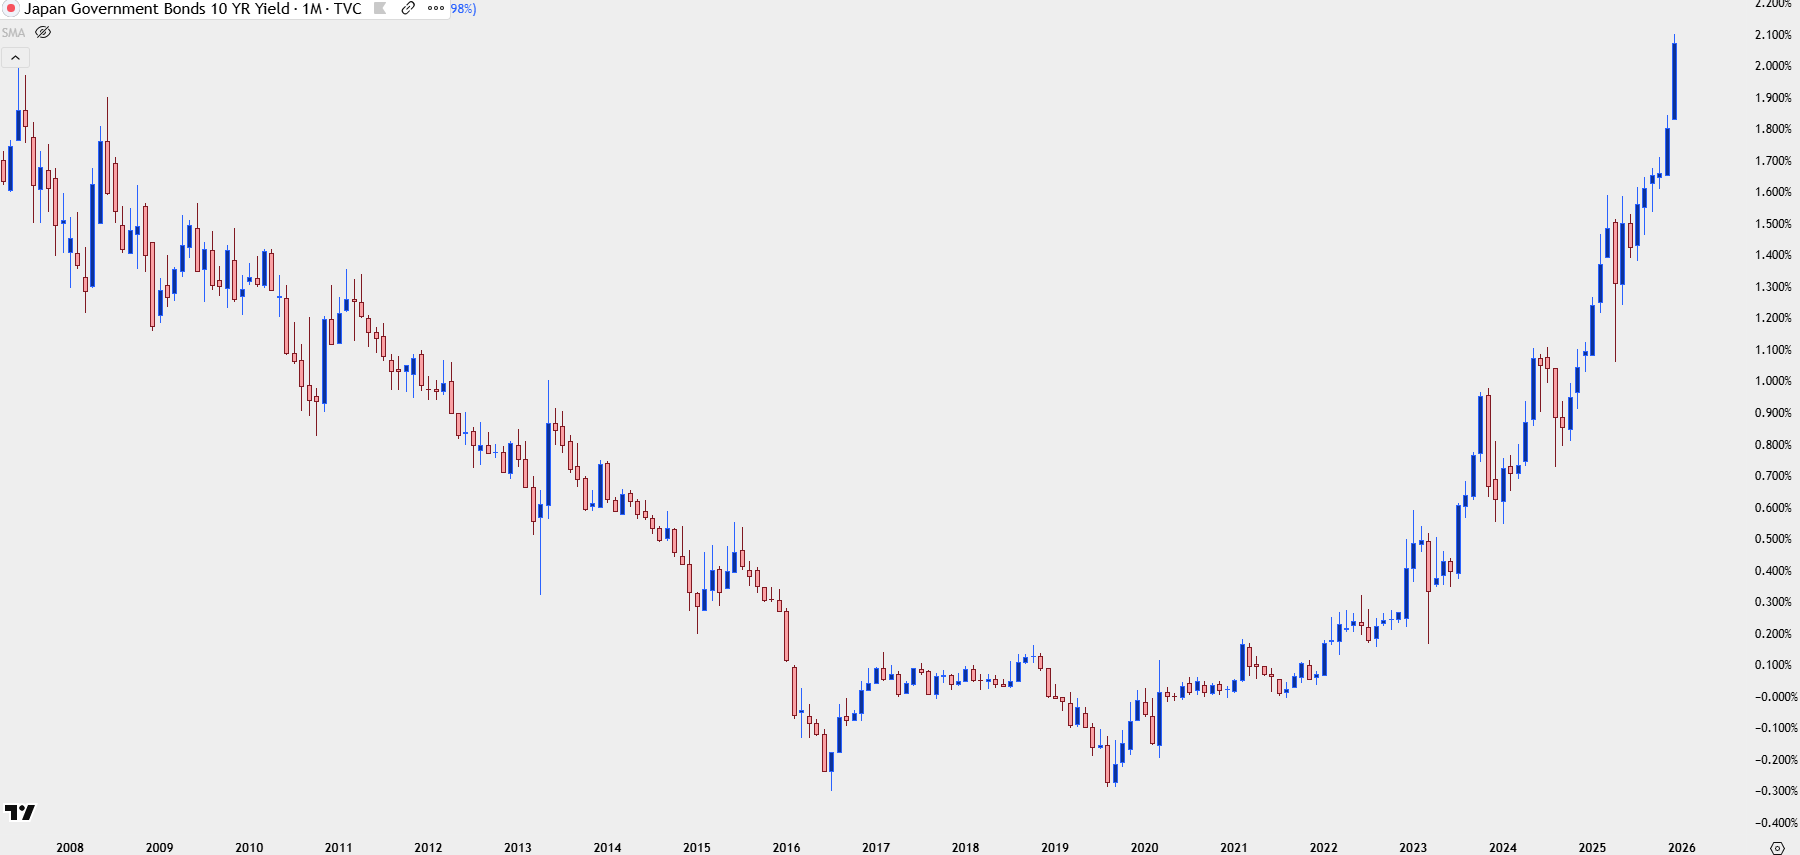
Chart prepared by James Stanley; data derived from Tradingview
Ideally, the Central Bank would hike rates to stem inflation and cool the nerves of bond markets, which are likely seeing some degree of selling driven by higher levels of inflation that remain unchecked by the BoJ. But – this isn’t a normal situation and there’s a massive risk to the rest of the world behind that scenario.
We saw a glimpse of this in the summer of 2024, when USD/JPY pushed above 160.00 for the second time and the Finance Ministry ordered the BoJ to intervene. The timing was almost perfect to run stops, as that was also the morning of a below-expected US CPI print, which finally gave life to the fact that the Fed would be able to cut in 2024.
But it didn’t take long before collateral damage began to show, with the high-flying tech trade in the U.S. coming off along with USD/JPY, and a week later, SPX topped and started to fall, as well. For the rest of July 2024, the focus was on Japan and the looming unwind of the carry trade that had driven for much of the prior three years with USD/JPY jumping from around 103 all the way above 160.00.

The Bank of Japan had to calm markets by looking away from rate hikes, but even then, the VIX index spiked to its third-highest level ever in early-August as US equities formed a local bottom. Matters shifted in Q4 when the Fed cut rates and Treasury yields jumped, but as Yen-weakness took over again in 2025, the fear of a USD/JPY above 160.00 again became a matter of contention.
We may be nearing the point where the BoJ has to choose between letting bond yields fly higher or defending the Yen; and the current Japanese Finance Minister has already remarked that she thought a reasonable range for USD/JPY would be between 120-130.
The big question in that scenario is what happens to US and, in turn, global equities in that scenario? If we see that much carry unwind, which is essentially a form of leverage, it’s difficult to imagine that there’s not at least some headwind for equities, which, again, complicates President Trump’s path towards mid-term elections later in the year.
And going back to the earlier point, the Japanese Yen is a 13.6% component of the DXY basket, so if Trump is to get the USD weakness that he’s been driving towards, a rally in the Yen could certainly help matters. But in this market the larger question around that is one of related repercussion.
USD/JPY Monthly Price Chart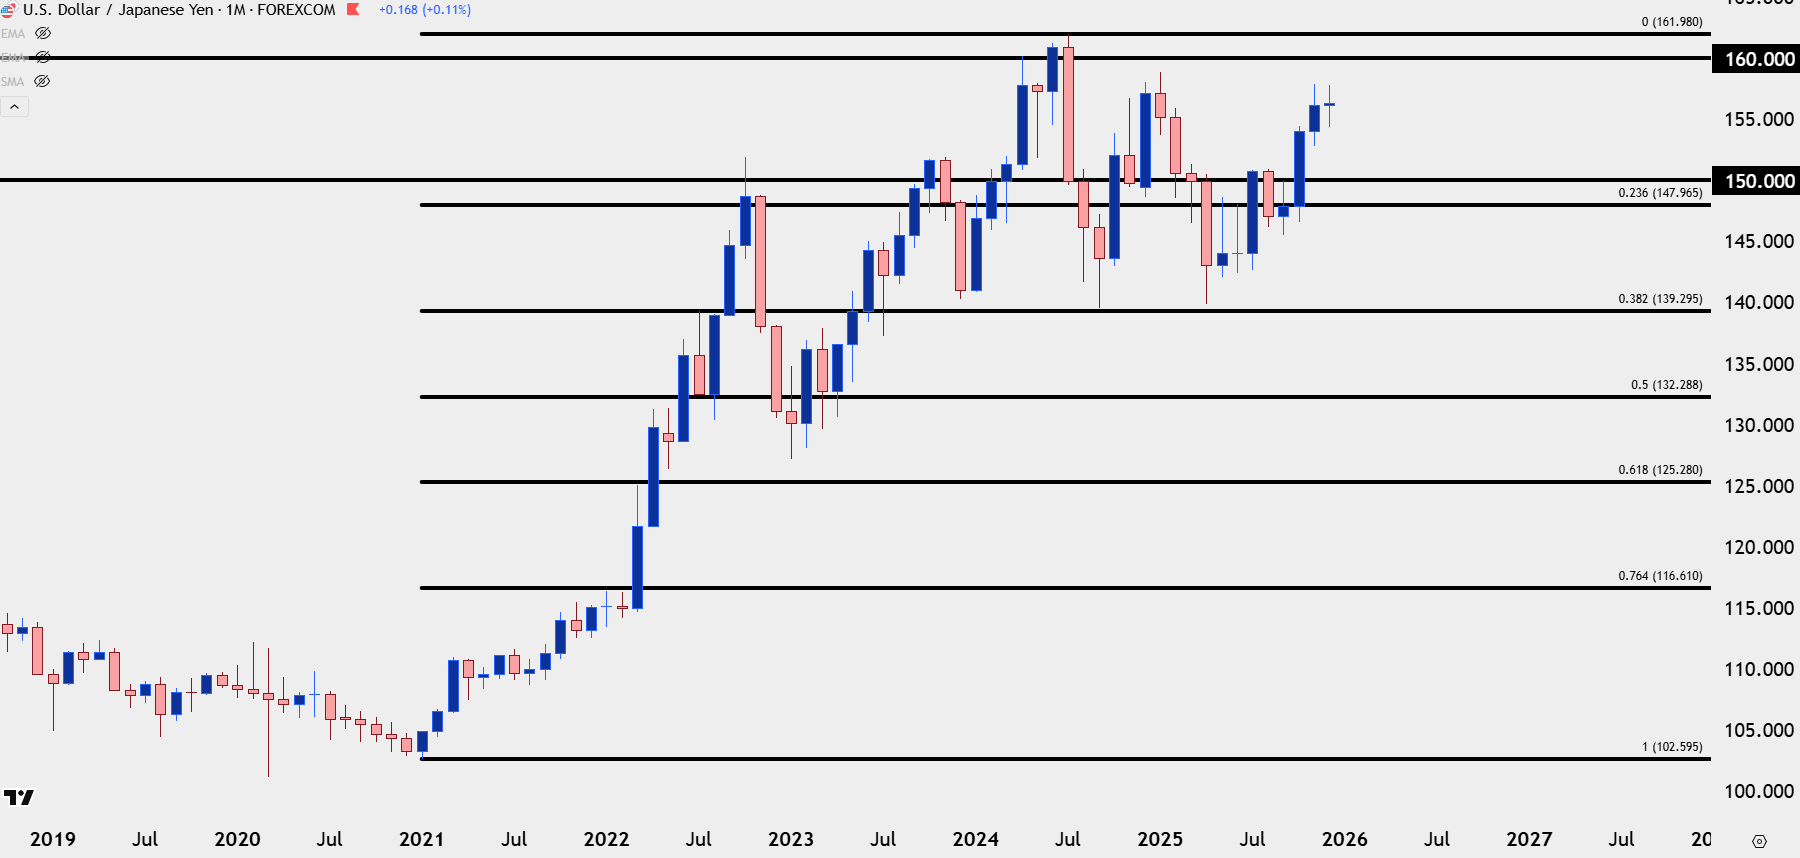
Chart prepared by James Stanley; data derived from Tradingview
Gold
I saved this for last because this is the market that I think is clearest, at least from a perspective of drivers.
I’ve told this story countless times over the past couple of years but the current bull market in gold got its start when Chicago Fed President Austan Goolsbee seemingly dismissed above-expected and above-target inflation.
As the Fed seemed determined to cut rates even with inflation high, gold prices started flying higher and they still haven’t really stopped, even with three different clear bull pennant formations building along the way.
If Trump gets his way and the Fed continues to lean into cuts in 2026 as we move into mid-terms, I think the fundamental backdrop remains attractive for gold. The risk to this would be inflation surprising to the upside to the point that the Fed is forced to hike, and given that Trump is able to nominate the next Fed Chair in the first-half of the year, this is a risk that could potentially be minimized by the bank letting inflation run hot.
Gold is my top trade idea for 2026, largely driven by the expectation for both monetary and fiscal policy to continue to push towards growth even if inflation ticks a bit higher.
Gold Weekly Chart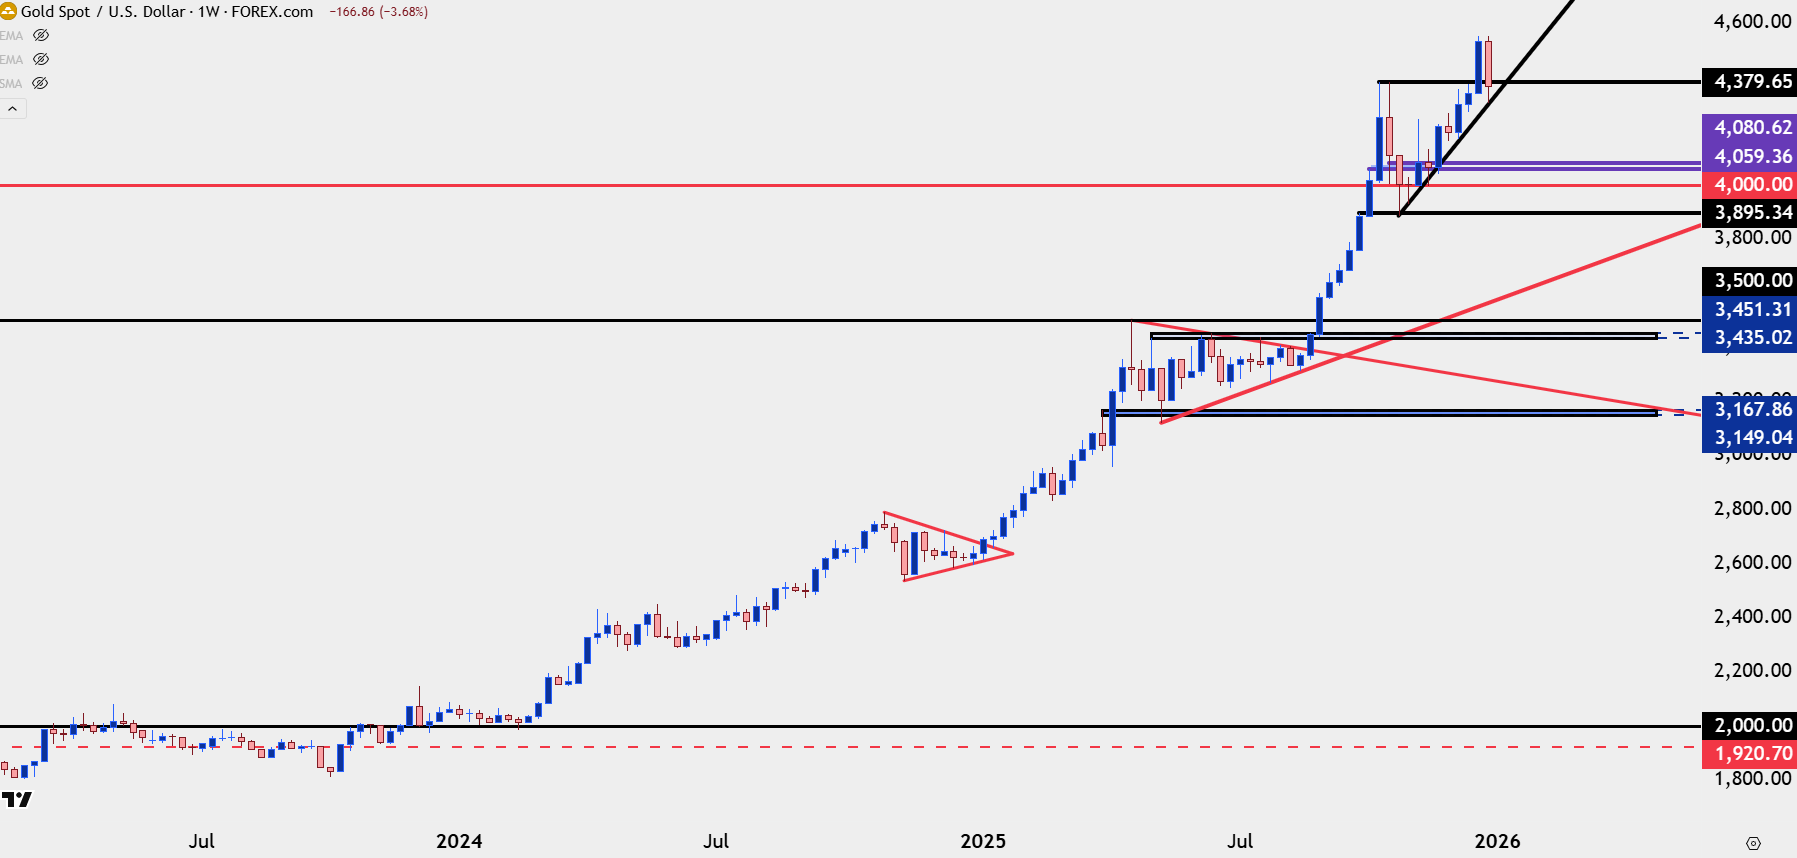
Chart prepared by James Stanley; data derived from Tradingview
--- written by James Stanley, Senior Market Analyst, Global Macro