



It was a rough first two weeks of Q2 for the US Dollar, which fast went from bullish breakout potential to oversold on the four-hour chart. This fed rallies in both EUR/USD and GBP/USD but, notably, USD/JPY held up fairly well and for the past few weeks has held within a range-bound formation as buyers have continued to show support around prior resistance.
As DXY has shown initial signs of recovery as looked at in the webinar yesterday, USD/JPY has pushed back up to the psychologically important 160.00 level, and given dynamics in the Strait of Hormuz there remains potential for bulls to take a shot at a break of the big figure.
USD/JPY Daily Price Chart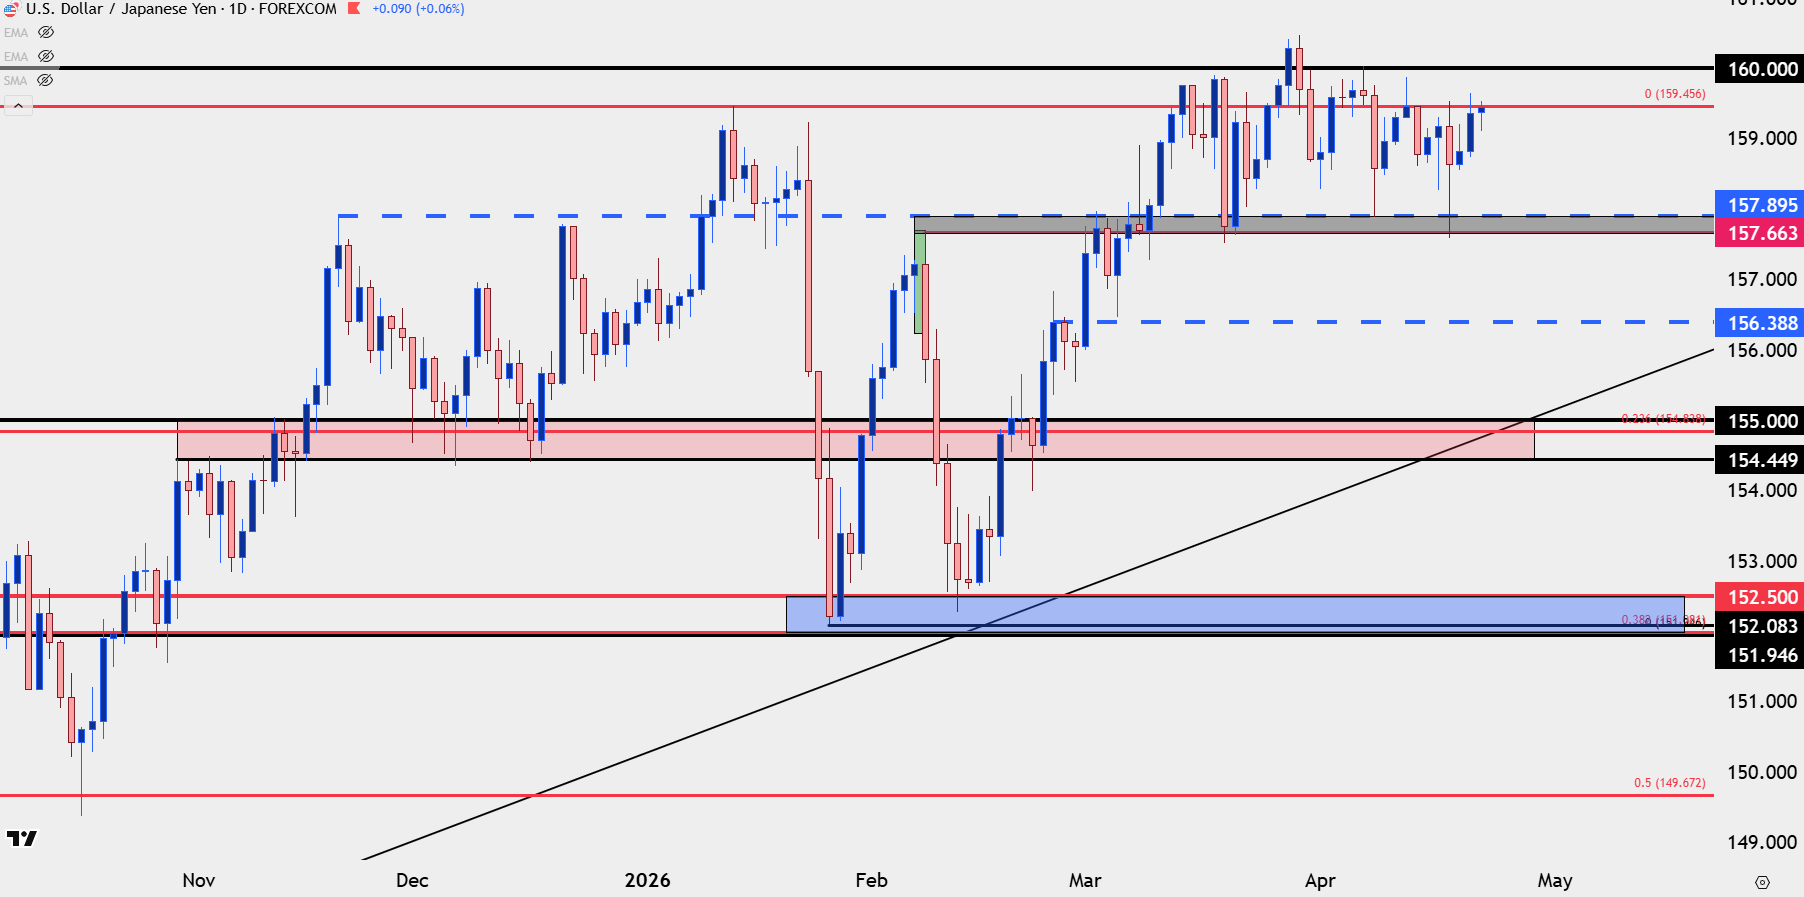
Chart prepared by James Stanley; data derived from Tradingview
The Dollar Domino Effect
We got a glimpse of this in the month of March but if we do see more tension in the Middle East with dwindling hopes of resolution then there could be justification for weaker spot rates in both the Euro and British Pound, and as the first and third largest components of the DXY basket, that could equate to a stronger USD.
In turn, that could boost the value of USD/JPY and we’re already near the 160.00 level, which was broken briefly a few weeks ago. The bigger question here is whether the BoJ will be so aggressive that they jump in to defend that spot quote – or whether they wait – and given the macroeconomic implication behind what would drive such a move, it might make more sense for them to cast their line in the sand back to a 161.95 or a 165.00 level, similar to what we saw in 2022 when the 145 level was driven through and then again in 2024 when 160 was initially defended, but buyers simply bought the dip and drove back up to fresh highs.
For USD-strength scenarios, I’ve been favoring USD/JPY and that remains the case as the DXY basket threatens a larger recovery.
USD/JPY Weekly Price Chart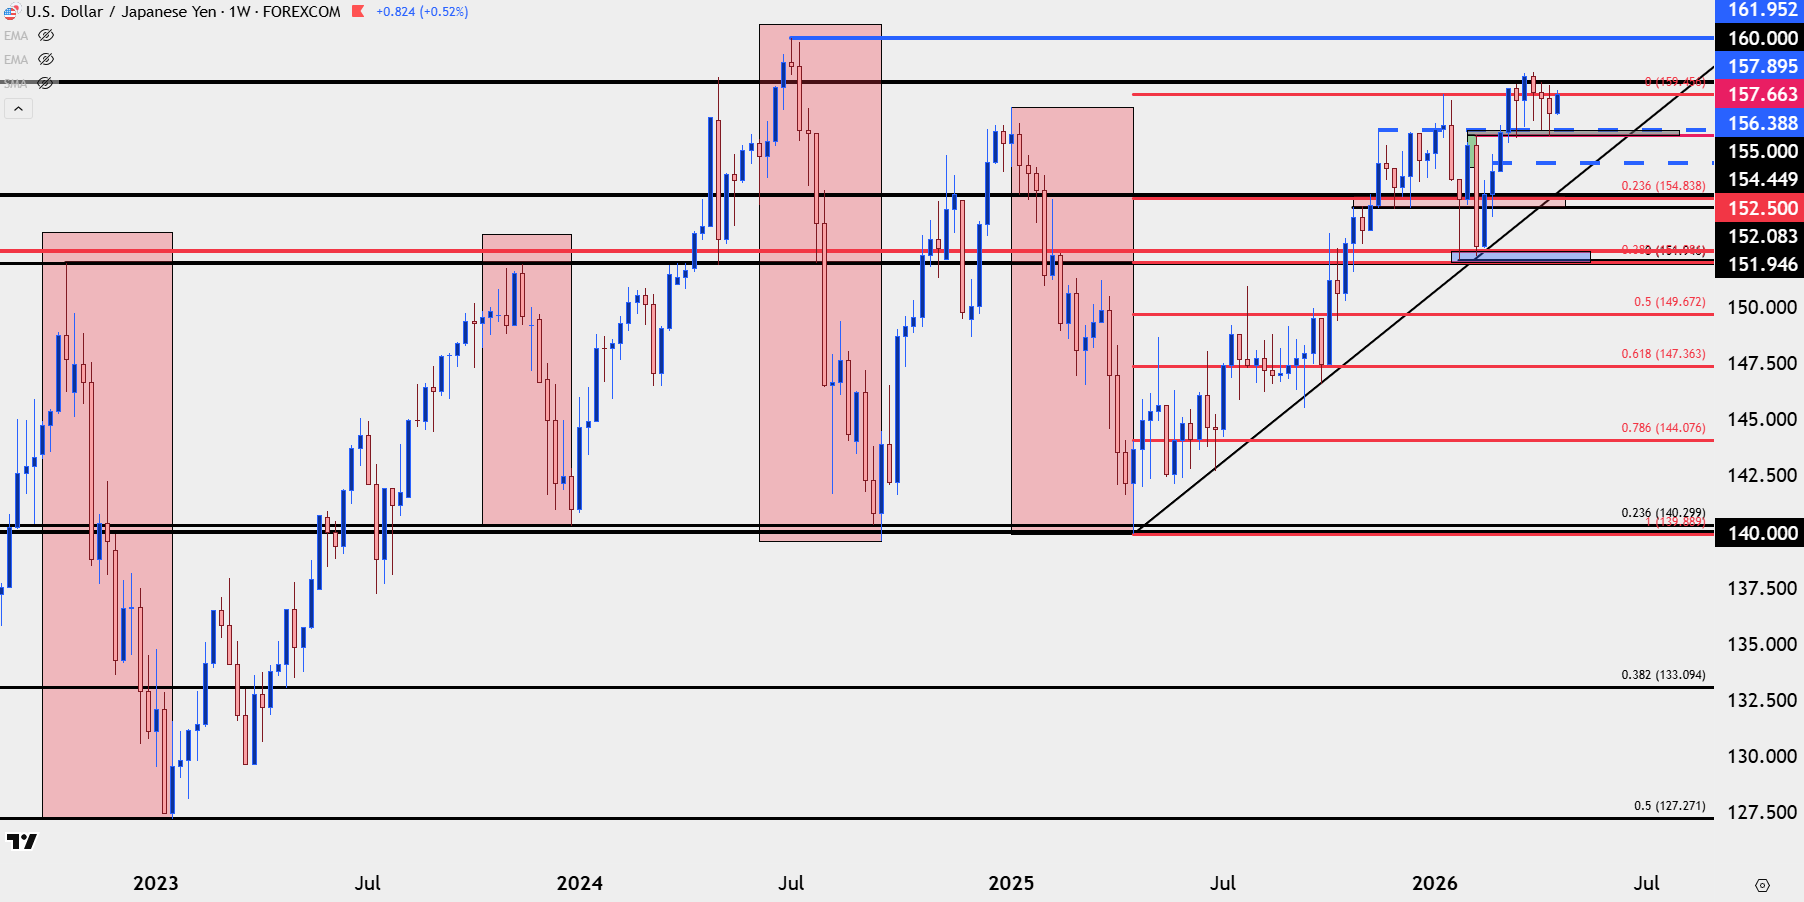
Chart prepared by James Stanley; data derived from Tradingview
EUR/JPY
The recent backdrop of relative USD weakness, but one in which the Japanese Yen was showing similar weakness, cross pairs like EUR/JPY were able to show explosive moves, and this has amounted to a fresh all-time-high in the pair as EUR/JPY broke out of a bull pennant formation in early-April.
I covered this in videos and webinars at the time and at this point, there’s still bullish potential, although if USD/JPY jumps through the 160.00 handle EUR/JPY and even GBP/JPY may lag behind the major pair.
In EUR/JPY, given the doji last week after that fresh ATH, the item of attraction is pullbacks and possible support tests at prior resistance, looking to levels like 185, and if that can’t hold, then 182.00.
EUR/JPY Weekly Price Chart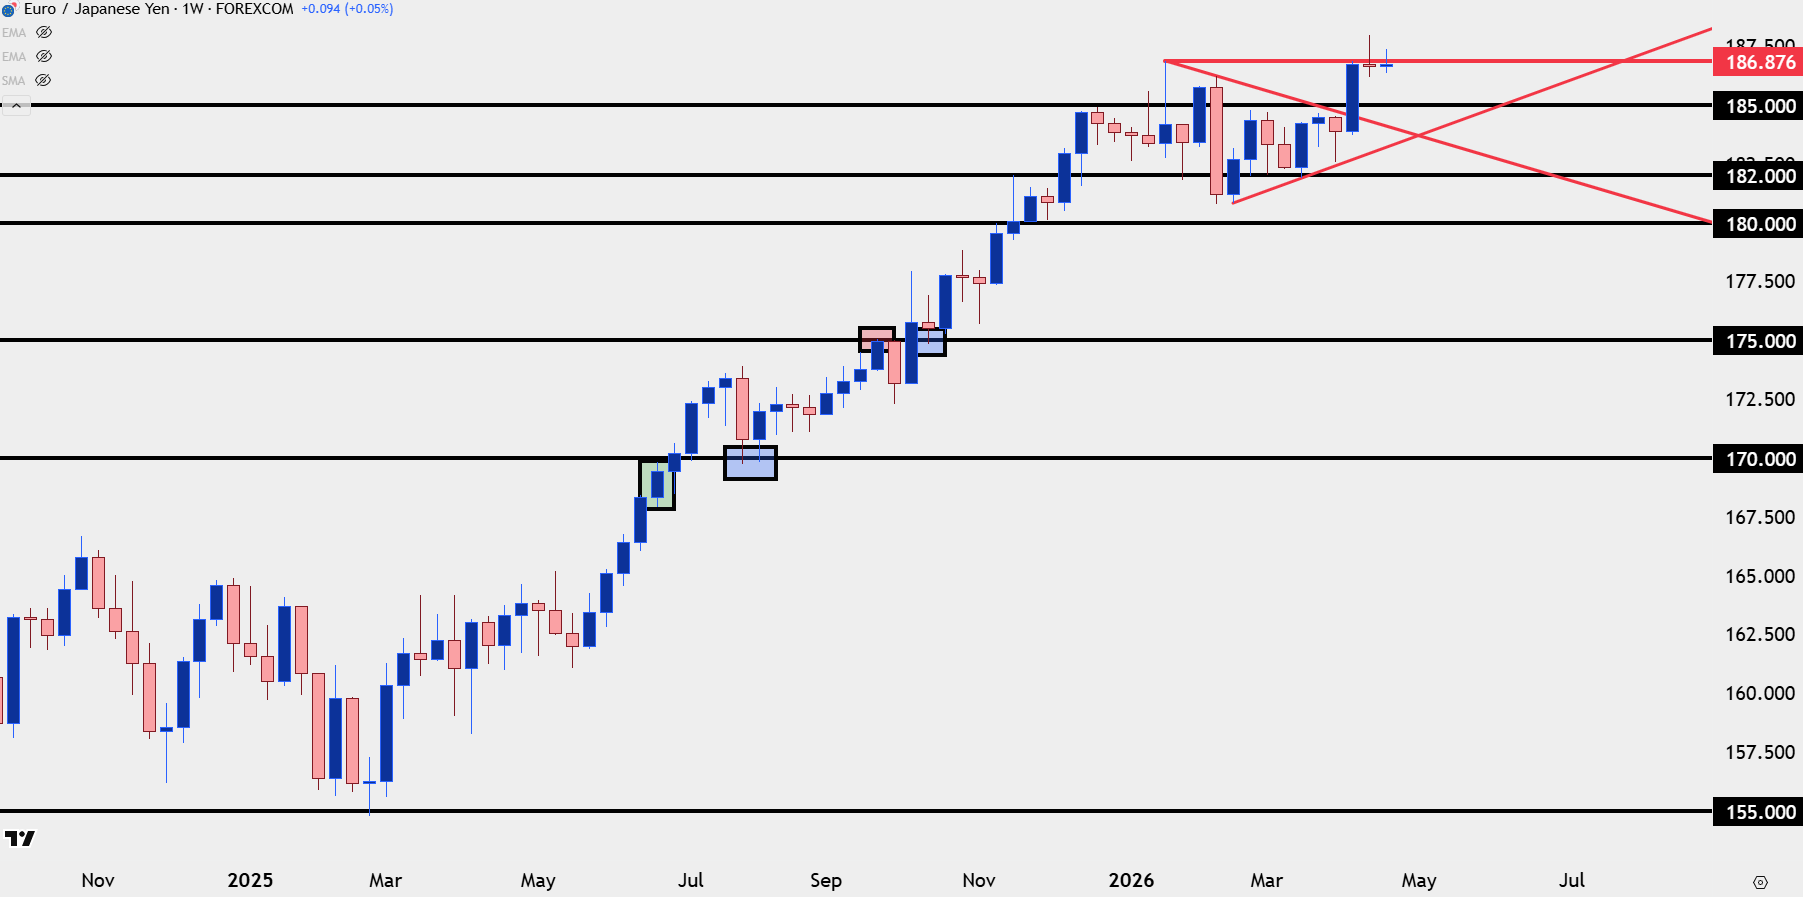
Chart prepared by James Stanley; data derived from Tradingview
GBP/JPY
Of late, I’ve been favoring the British Pound over the Euro and looking at the major pairs currently illustrates why, as GBP/USD has held support at a horizontal level, which is also prior resistance, while EUR/USD has continued to draw down to fresh lows.
That sterling preference can show against the Yen, as well, although the backdrop here isn’t quite as indecisive as what was looked at above in EUR/JPY. In GBP/JPY, the pair has so far extended its bounce from 214.30 support. But the rally has also slowed over the past couple of days and at this point, it looks like buyers don’t want to re-test the 215.83 swing high, which is a notable level of long-term relevance. I had looked at that on Monday, and while I wouldn’t quite want to set this up for bearish reversals, I’d be cautious of chasing fresh breaks and, instead, would look to pullbacks and shows of support before pressing the long side of the pair.
GBP/JPY Daily Chart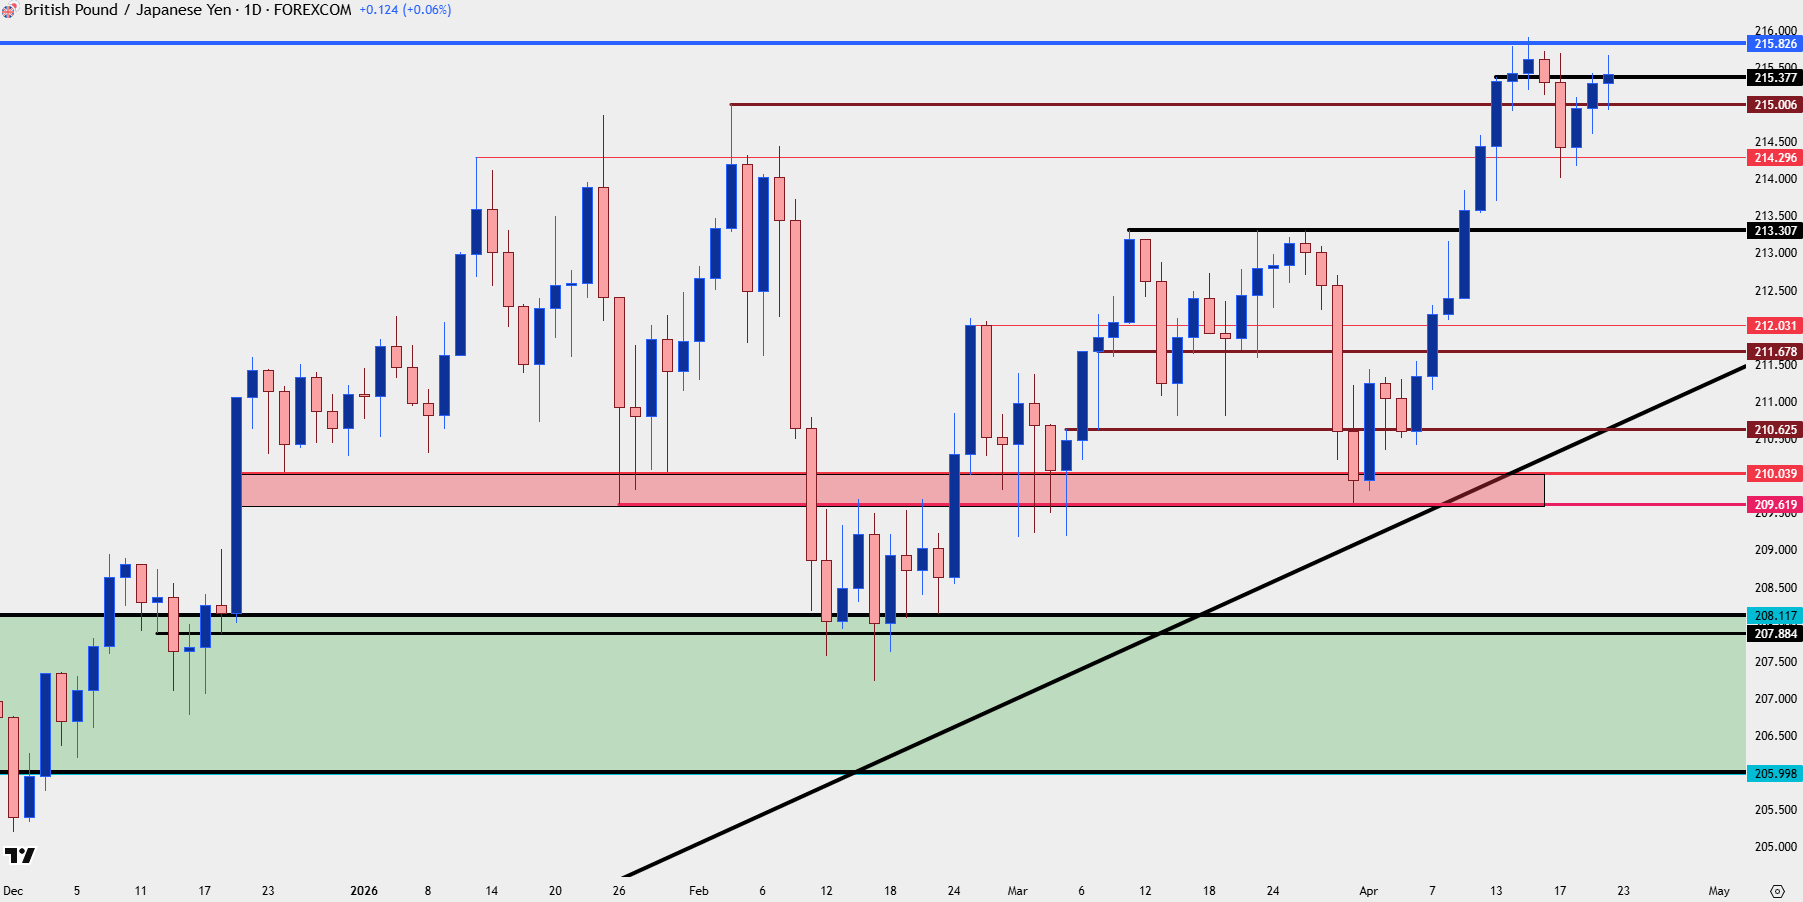
Chart prepared by James Stanley; data derived from Tradingview
--- written by James Stanley, Senior Market Analyst, Global Macro






