
Despite the sharp pullback across USD/JPY and the US Dollar Index (DXY), the broader bullish structure remains intact. The latest correction appears to have been driven primarily by profit-taking, renewed Bank of Japan intervention concerns, and positioning adjustments following USD/JPY's test of major long-term resistance, rather than a meaningful deterioration in the US dollar's macroeconomic outlook.
As long as Middle East tensions continue disrupting energy markets and supporting elevated crude oil prices, inflation risks remain tilted to the upside. Together with resilient US Treasury yields, these factors continue to reinforce the broader bullish outlook for the US dollar.
Several important technical structures are now being tested, helping define whether the latest pullback represents a healthy correction within the prevailing uptrend or the beginning of a broader reversal.

Key patterns in focus
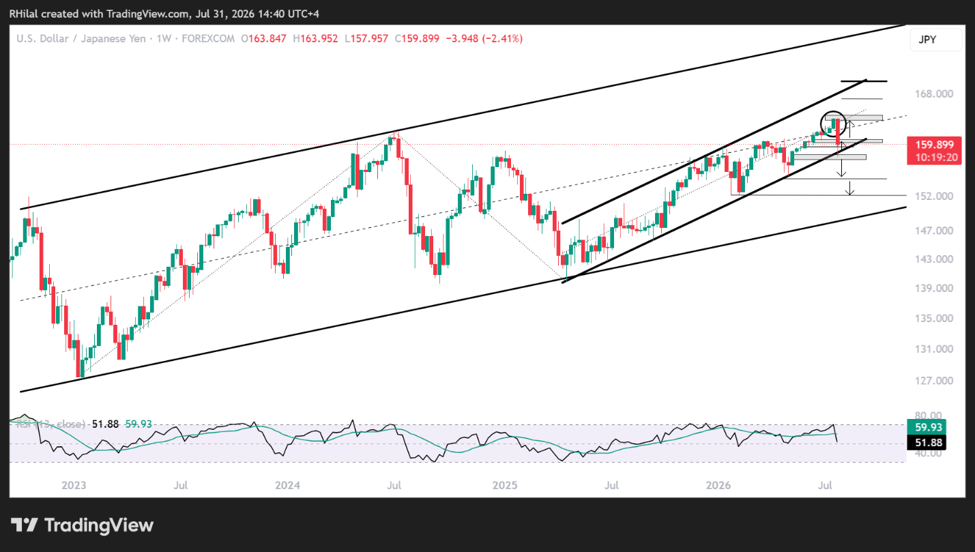
- USD/JPY's nearly 500-point correction coincided with the lower boundary of the April 2025–July 2026 ascending channel, renewed BOJ intervention expectations, and profit-taking after the pair tested the 164 resistance zone.
- That resistance also aligned with one of the year's strongest technical confluence zones, including the midpoint of both the 2025–2026 and 2022–2026 ascending channels, alongside overbought momentum conditions across multiple timeframes.
- The correction may have allowed momentum to reset before another attempt at fresh yearly highs.
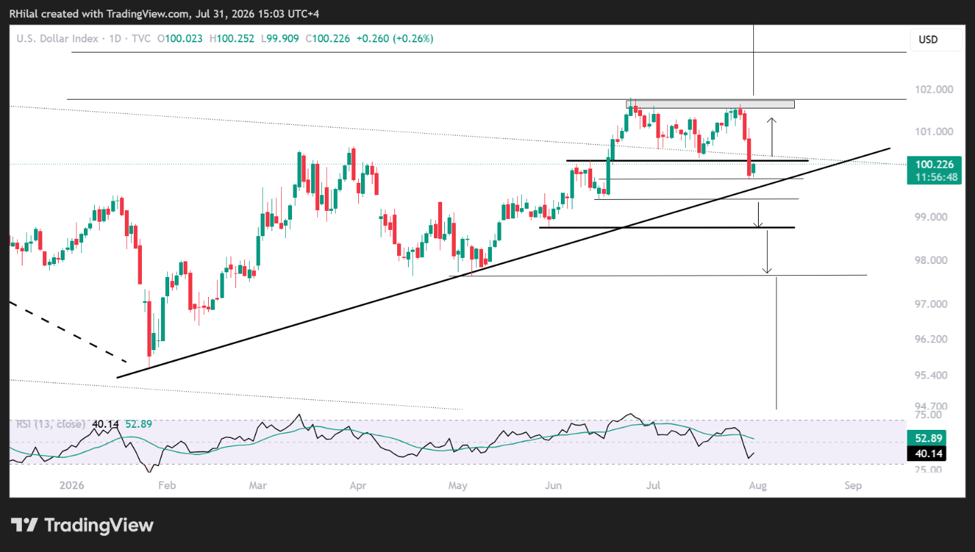
- The DXY also corrected alongside USD/JPY as markets reassessed Federal Reserve decision following the July meeting. Despite the pullback, the index continues to respect its year-long bullish structure above major trend support.
The broader bullish dollar outlook remains valid provided:
- DXY holds above the 99.30–100.30 support zone.
- USD/JPY remains above 157.50–158.00.
- Middle East supply disruptions continue supporting elevated crude oil prices.
I covered these scenarios in my latest bi-weekly webinar.
USD/JPY Price Outlook: Weekly Time Frame – Log Scale
Source: TradingView
Following the nearly 500-point correction, USD/JPY is testing another major technical confluence zone.
Current support aligns with:
- The April 2025–July 2026 ascending trendline.
- The 27.2% Fibonacci retracement of the April 2025–July 2026 advance near 158.00–157.50.
- Oversold momentum conditions on the daily timeframe.
- Weekly RSI holding above the neutral 50 level.
This technical confluence follows the rejection from the 164 resistance zone, where price simultaneously tested the midpoint of both the 2022–2026 and 2025–2026 ascending channels.
Taken together, these factors continue to favor the broader bullish structure unless price records a decisive weekly close below 157.00.
Bullish Scenario
A recovery above 160.60 would shift attention back toward the major resistance zone between 163.70 and 164.70, where another period of consolidation or profit-taking could emerge.
A successful breakout above this area would expose the next upside objectives near:
- 167
- 170
These correspond to the upper boundary of the April–July ascending channel.
Bearish Scenario
A decisive break below 157.00 would expose the next major support levels near:
- 155
- 152
- 149
These levels coincide with the lower boundary of the broader 2022–2026 ascending channel and represent the next significant technical support should the current bullish structure fail.
DXY Price Outlook: Daily Time Frame – Log Scale
Source: TradingView
The recent pullback in the DXY occurred just below the critical 102.00 resistance zone, which remains the key level required to confirm another bullish breakout.
Despite the decline, price action continues to respect the ascending trendline connecting the higher lows established throughout 2026, reinforcing the broader bullish structure.
As long as the index remains above the 99.30–100.30 support zone, the long-term bullish outlook remains intact.
The daily chart therefore continues to suggest that the recent weakness represents a correction within the prevailing uptrend rather than the beginning of a broader reversal.
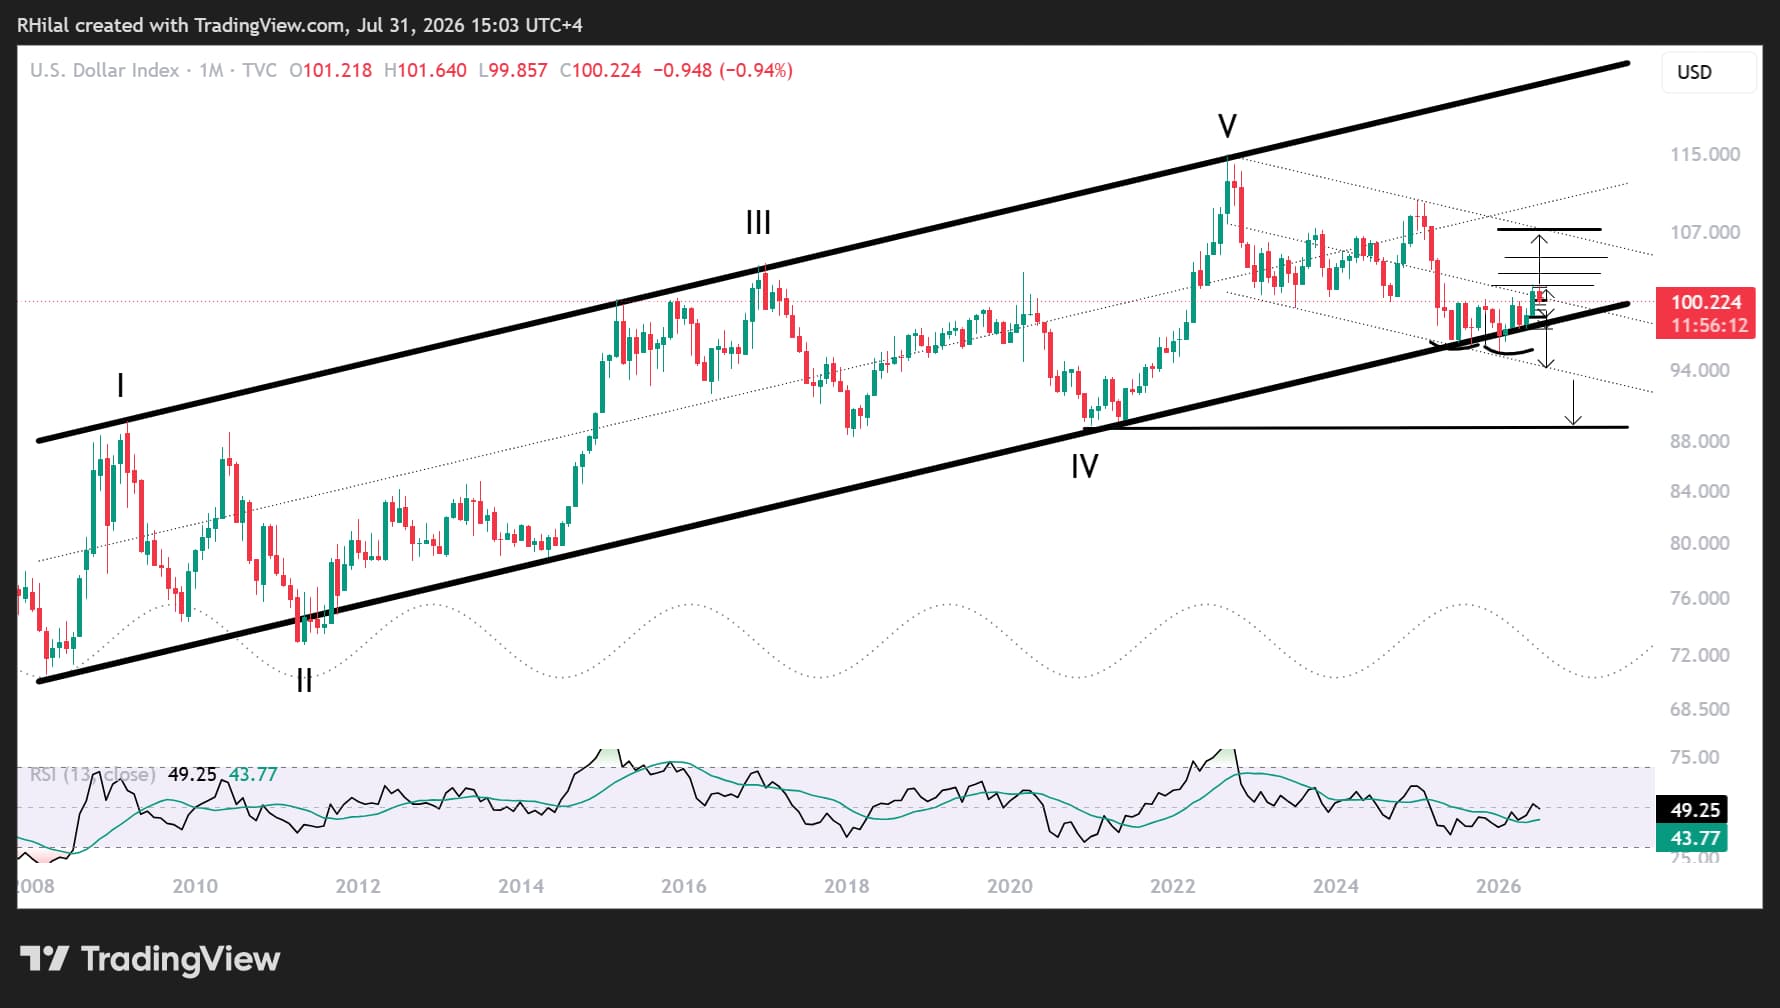
DXY Price Outlook: Monthly Time Frame – Log Scale
Source: Trading view
The monthly chart continues to reinforce the US Dollar Index's broader bullish structure through several important technical developments:
- An ascending channel dating back to 2008 continues to support the Dollar Index's long-term uptrend. Its lower boundary, near the 95–97 zone, remains the next major support area should the DXY close below 99.30, invalidating the 2026 bullish structure. Such a move could either trigger another long-term rebound or mark the beginning of a broader structural drawdown.
- The DXY is currently testing a major technical confluence that includes:
- The neckline of a potential double-bottom pattern, positioned between the long-term 2008 ascending channel and the 2022–2026 descending channel.
- The midpoint of the 2022–2026 descending channel.
- A multi-year support and resistance zone that has repeatedly defined price action since 2023.
A monthly close above 102.00 would strengthen the bullish outlook, exposing the next resistance levels at 102.80, 104.50, and ultimately 107.00, which coincides with the upper boundary of the descending channel in place since 2022.
Such a move would likely coincide with renewed geopolitical tensions, stronger inflationary pressures, or a more hawkish Federal Reserve. It would also increase downside pressure across major currencies and precious metals, potentially pushing them toward fresh yearly lows before a longer-term reversal emerges.
As long as Middle East tensions persist, crude oil prices remain supported above the $70–80 per barrel region, and dollar pairs continue to hold above their year-long bullish structures, downside risks across global markets are likely to remain elevated.
Written by Razan Hilal, CMT
Follow on X: @Rh_waves