


The US dollar surged for a fifth consecutive day on Wednesday after the Federal Reserve offered no signal of a near-term rate cut, lifting the USD/JPY to a four-month high. With the Fed dashing hopes of a September cut, attention now turns to the Bank of Japan (BOJ), whose upcoming decision could determine whether USD/JPY breaks above the key 150 level. A hawkish surprise from the BOJ could stall the dollar’s rally—but anything less might pave the way toward 151 and beyond.
View related analysis:
- USD Positioning Hints At Sentiment Extreme: COT report
- AUD/USD Eyes 0.64 as CPI Looms, RBA and Fed Decisions in Focus
- AUD/USD Weekly Outlook: RBA Cut Bets Weigh on the Australian Dollar
US Dollar Strengthens Post-FOMC, Eyes Turn to BOJ
The US dollar extended its countertrend rally on Wednesday after the Federal Reserve (Fed) failed to hint at a September rate cut, despite prior market pricing. While two Fed voting members dissented in favour of a 25bp cut—the first double dissent since 1993—it had little market impact, especially given how vocal Waller and Bowman have been recently in support of easing.
There were few notable changes to the FOMC statement, which maintained its view of a resilient economy, a tight labour market, and persistent inflationary pressures. Chair Jerome Powell reinforced the hawkish tone, warning during his press conference that inflation effects could be “more persistent” than previously expected.
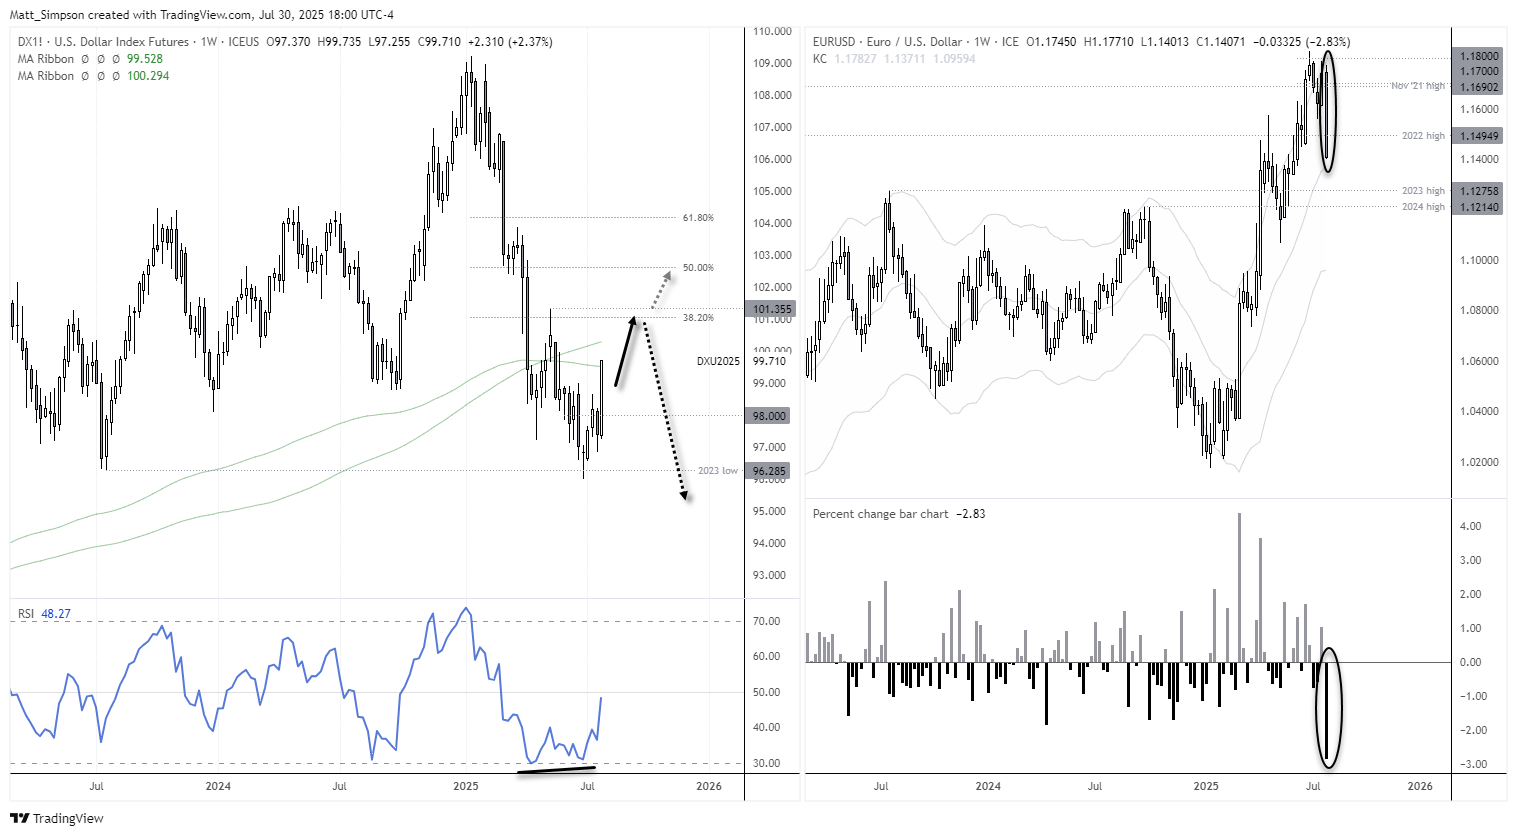
The US dollar index (DXY) gained 1%—its second consecutive daily rally of that magnitude. The DXY has now risen for five straight sessions, up 3.9% from its July low, with bullish momentum accelerating. As noted in prior reports, the dollar appeared oversold based on recent price action and positioning data from the weekly Commitment of Traders (COT) report.

Major FX Moves: EUR/USD, USD/JPY, and AUD/USD
- The US dollar index (DXY) gained 1%—its second consecutive daily rally of that magnitude. The DXY has now risen for five straight sessions, up 3.9% from its July low, with bullish momentum accelerating. As noted in prior reports, the dollar appeared oversold based on recent price action and positioning data from the weekly Commitment of Traders (COT) report.
- EUR/USD fell to a 7-week low and is on track for its worst weekly performance since September 2022. The bearish momentum suggests potential for further downside toward the 2023 and 2024 highs at 1.1214/78.
- USD/JPY reached a 4-month high and is trading approximately 50 pips below the key 150 handle. Bulls appear poised to break through this level—particularly if the Bank of Japan (BOJ) refrains from delivering a hawkish surprise at today’s meeting.
- AUD/USD declined by 1.2% amid a double-blow of renewed RBA rate cut expectations and a less-dovish-than-anticipated Federal Reserve. With the pair down for a fifth consecutive session, the near-term bias remains bearish, targeting 0.6400 or the 200-day simple moving average at 0.6387. A break beneath 0.6357 would signal the potential for a deeper corrective move.

USD/JPY Technical Analysis: US Dollar vs Japanese Yen
A bullish engulfing candle has formed on the USD/JPY daily chart, ahead of today’s key BOJ meeting. Price found support near the 200-day exponential moving average (EMA) and the 148.00 handle, while the 200-day simple moving average (SMA) acted as resistance at the session high. With bullish momentum building and the broader daily trend turning higher, the bias favours a breakout above the 200-day SMA and psychological 150.00 level.
A 100% Fibonacci projection of the April low to May high—measured from the May pullback—targets the 151.00–151.30 zone, just beneath the March high. A sustained breakout could unlock further gains toward 154.80, aligning with the 78.6% Fibonacci retracement and reinforcing the long-term bullish outlook for USD/JPY.
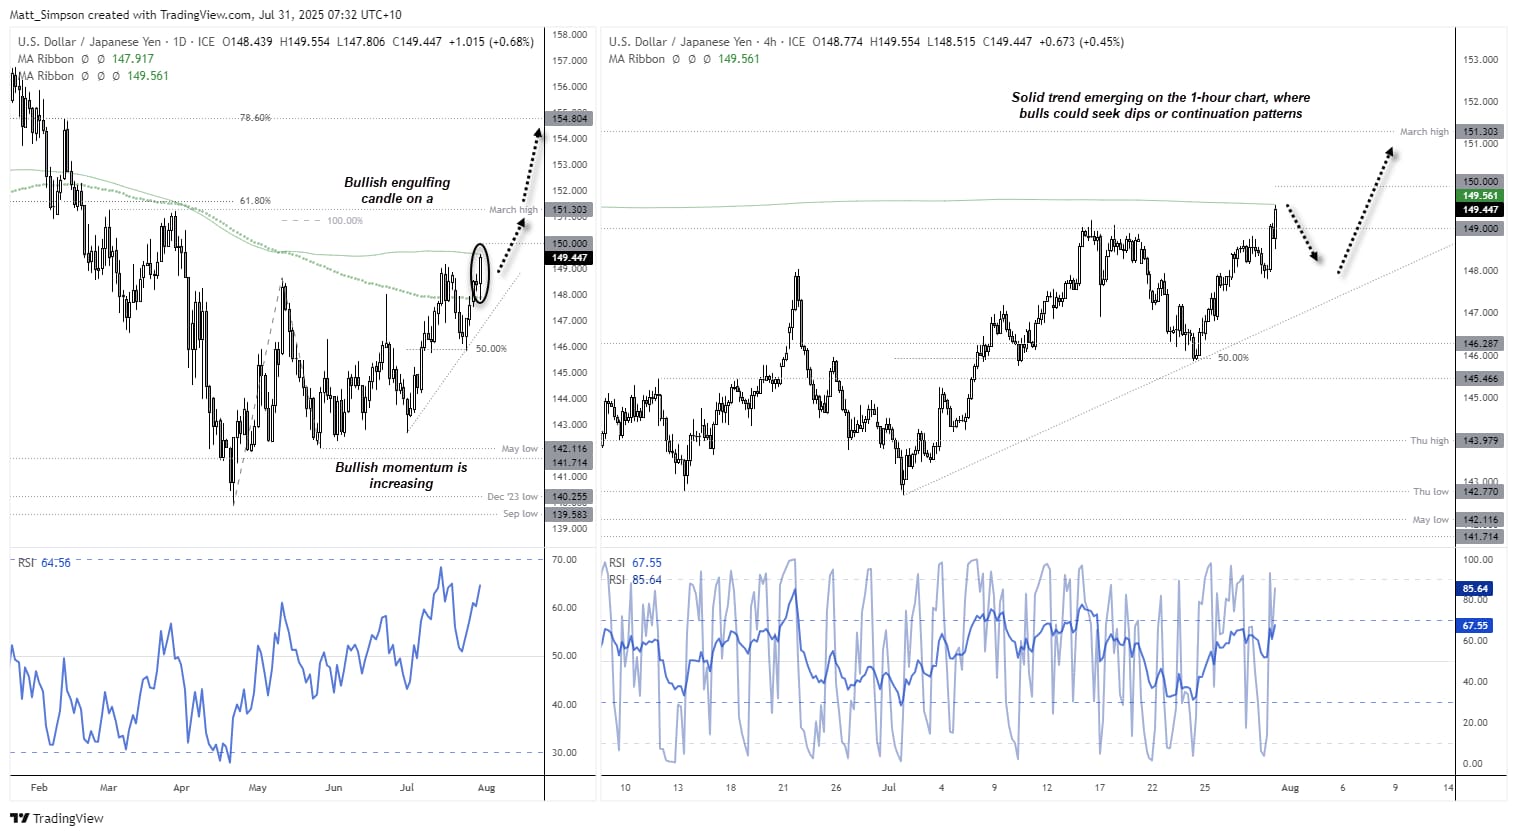
Chart analysis by Matt Simpson - data source: TradingView USD/JPY






