
The one-year uptrend on the USD/JPY chart continues to hold, supported by sustained dollar strength, even as BOJ tightening expectations increase.
Following the BOJ’s Summary of Opinions, Japanese government bond yields surged to their highest levels since 1999, approaching 2.6%, while US 10-year and 2-year Treasury yields climbed to yearly highs above 4%.

Source: Trading Economics
Macro Backdrop: Inflation & Energy Shock Driving Yields
Behind this yield surge lies a persistent inflationary environment driven by prolonged energy market recovery risks. These include disruptions around the Strait of Hormuz, rising insurance premiums, and delays in restoring full production capacity.
April inflation data reflects these pressures:
- China PPI at 2.8%, near four-year highs
- US CPI at 3.8%, near three-year highs
- US PPI at 1.4%, near four-year highs
This inflation narrative is stabilizing the US dollar, pushing bond yields higher, and weighing on gold.
In the context of USD/JPY, rising US yields, hawkish Federal Reserve expectations, and safe-haven demand amid geopolitical tensions are keeping the pair supported within its one-year uptrend—despite potential BOJ intervention that has tested the stability of this channel.
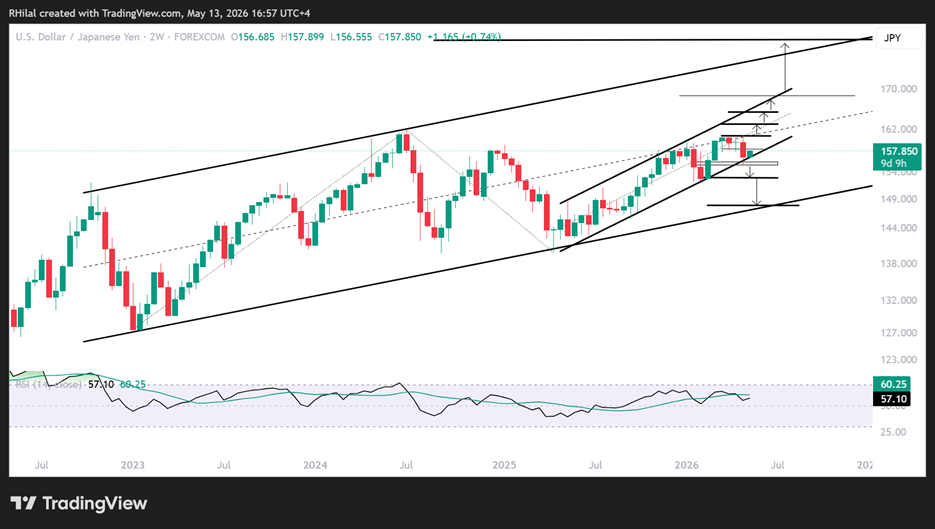
USDJPY Price Outlook: Weekly Time Frame – Log Scale
Source: Trading view
To quantify uncertainty through price action, USD/JPY must be assessed across multiple time frames. On the weekly chart, the pair continues to respect a parallel uptrend established since April 2025, holding above the 155 support zone.
This structure is now challenging the mid-zone resistance of a broader channel extending from the 2022 lows toward 2026—making this area a pivotal decision point for trend continuation or reversal, near 160
Bullish Scenario: Continuation Above 160
A sustained break and weekly close above 158–160 would confirm renewed bullish momentum. In this scenario, price action could extend toward:
- 166
- 174
- 180
These levels align with Fibonacci projections (0.618, 0.786, 1.0, 1.272) of the broader cycle between the 127 low (2023), 161.70 high (2024), and 140 low (2025), while also coinciding with the upper boundary of the long-term ascending channel.
Bearish Scenario: Breakdown Below 155
Failure to reclaim 160, combined with sustained pressure below the channel mid-zone, increases the probability of a downside move. A confirmed break below 155 would signal a structural shift, opening the path toward:
- 152 (yearly lows)
- 150 (psychological level)
- 147 (channel support)
Such a move would reflect a deeper repositioning in USD/JPY, potentially driven by BOJ intervention or a broader shift in dollar sentiment.
USDJPY Price Outlook: 3 - Month Time Frame – Log Scale

Source: Trading view
From a longer-term perspective, the 160 level remains a major historical resistance dating back to the 1990 highs. A confirmed breakout above this zone could unlock a structural rally toward the 180 region, revisiting levels last seen in the late 1970s and reinforcing the broader bullish trend.
On the downside, the 147 level, marking the lower boundary of the 2022–2026 channel, remains a critical support. A break below this level could accelerate losses toward the 140 and 130 ranges, potentially aligning with a broader US dollar index (DXY) breakdown below its long-term 2008–2026 uptrend

Final Thoughts: Price Action as a Measure of Market Truth
While macro headlines around BOJ intervention, inflation, and global risk sentiment continue to drive volatility, price action remains the most reliable measure of market positioning.
In USD/JPY, the reaction around 155 and 160 will define the next major trend—whether through continued dollar strength or a sharp reversal driven by policy intervention and a potential unwind in carry trades.
Written by Razan Hilal, CMT
Follow on X: @rh_waves