
USD/JPY Talking Points:
- The pullback earlier in the week has so far held support at prior resistance, and price is right back up to the 160.00 level going into the end of the week.
- The breakout setup from the prior week led to clean continuation.
- The question now is whether bulls will try their luck with another 160.00 break, as the prior test of that level back in September was met with an intervention threat.
- Interventions are not ideal as it requires burning finite FX reserves, and for a US dealing with surging interest rates and high inflation the bar for spending those reserves should be high. Meanwhile, for Japan to deploy reserves it would likely mean selling Treasuries which would spell even higher rates for US debt.
USD/JPY is on the verge of breakout again as the pair has simply ran right back up to the psychological level of 160.00.
For the past couple of months the pair has remained an attractive venue following pullbacks, and this is perhaps one reason that we’ve seen the string of higher-lows develop until the current re-test of the big figure. But this is where the proverbial rubber hits the road as, so far, bulls haven’t been able to hold a move above the 160.00 handle and ever since the last test up there in September, there’s been a slowing of buying pressure whenever prices have tilted above that level.
USD/JPY Daily Price Chart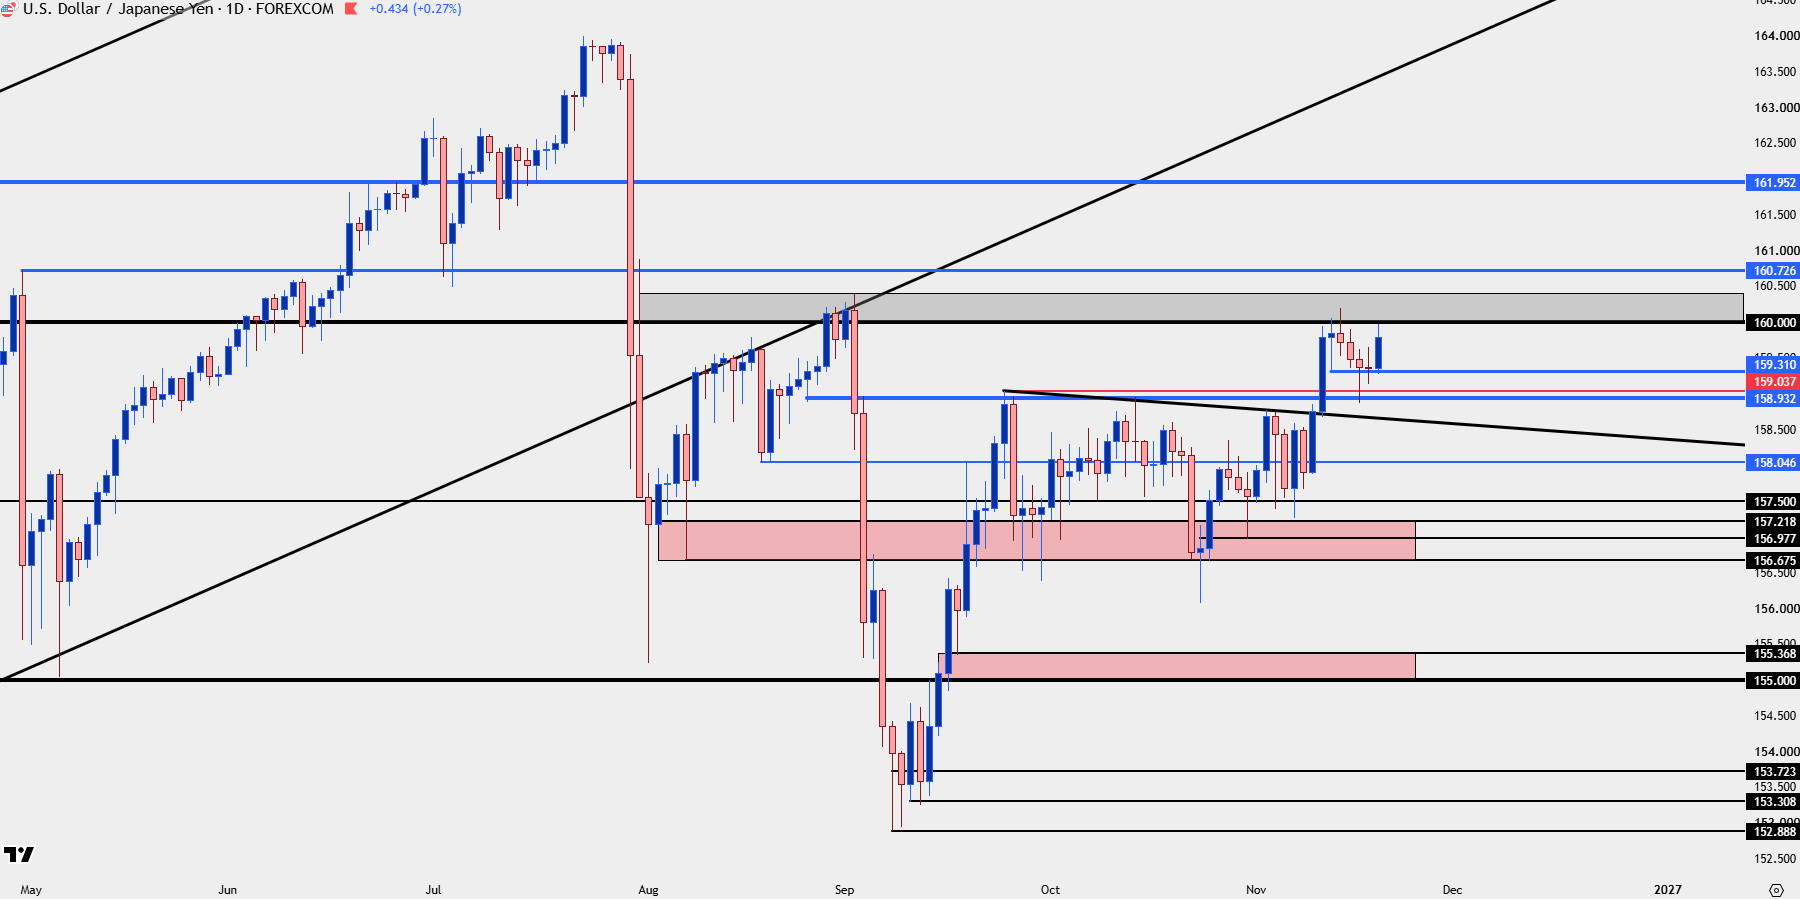
Chart prepared by James Stanley; data derived from Tradingview
USD/JPY: Between a Rock and a Hard Place
The fundamental bias remains tilted to the long side of the pair and this week has only seen that relationship grow more pronounced. A very hawkish FOMC combined with higher inflation in the US makes the bar for rate hikes uneven between the two economies. The BoJ hiked in September, even with inflation below their own 2% target, and markets saw right through that with USD/JPY breakout out shortly after. As a matter of fact, the resistance from just after that breakout is what helped to set support earlier this week around the 159 handle.
As we go into December, even with chances of another hike from the BoJ, there’s still disparity given inflation and there’s now the build of expectation for the Fed to hike again in December, and perhaps another two or three times next year. This makes it difficult to justify bearish setups in the pair as anything more than a pullback.
The one scenario where this might change would be similar to what happened back in 2022 or 2023, when slower CPI threatened rate divergence between the two economies, and longs were jolted out of positions as we experienced a ‘down the elevator’ type of move after months of ‘up the stairs.’
But even that comes with the possibility of collateral damage, as we saw in July of 2024 when USD/JPY unwound in a big way but also drove sizable sell-offs in the Nasdaq, S&P 500 and Nikkei. In the latter, that sell-off spanned more than 27% at one point and that’s around when the pair set a significant low. And then from April 2025 through this year, the index jumped in a massive way and still remains more than 90% above the low from last year.
So if we do see any significant surge of carry unwind, it could possibly hit stocks, as well, which is certainly something that US Treasury Secretary Scott Bessent would not want to see.
Nikkei Weekly Chart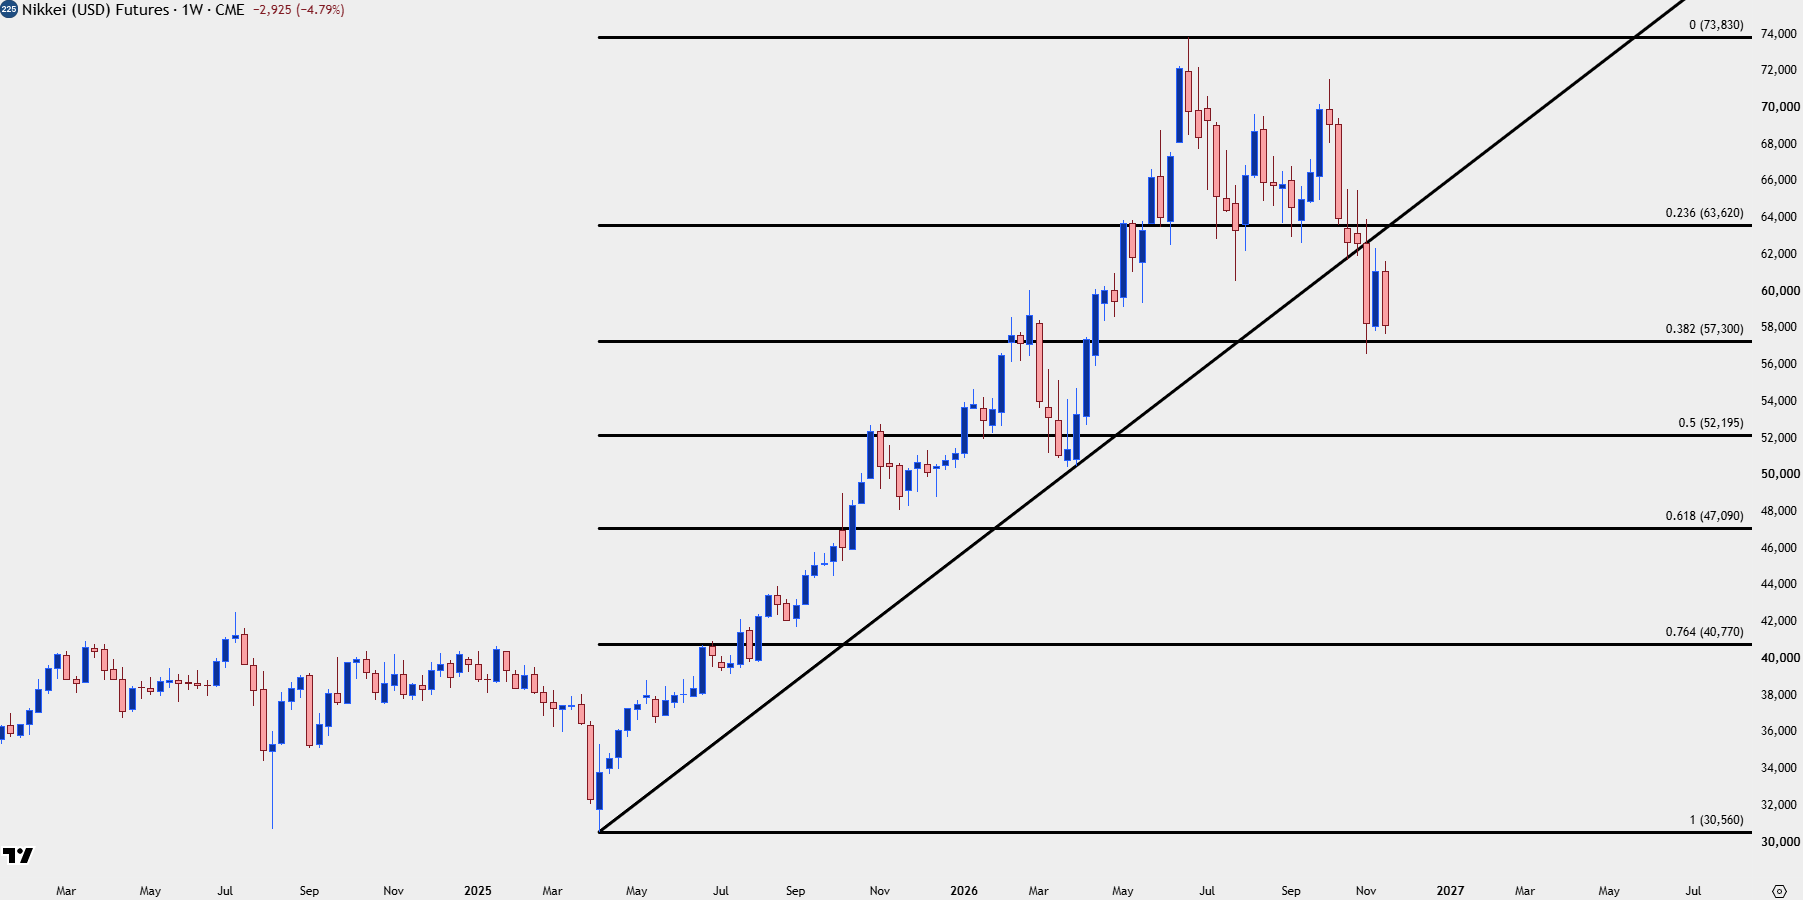
Chart prepared by James Stanley; data derived from Tradingview
USD/JPY Short-Term
Breakouts can be seen as tough here given that risk of an intervention threat creating an outsized pullback. That can skew possible risk-reward which then makes the idea of trading a breakout a more challenging prospect. However, with that said, there’s likely stops on short positions sitting above the big figure, and if bulls do venture a test above that price, those buy to cover orders can quickly spell for a fast rally.
But perhaps the more attractive way to deal with such a situation is to trade the near-term trend, trying to work with pullbacks, and then managing risk at or around the 160.00 test and perhaps even scaling out of some of the position, so that way if a breakout does run the trader can have some remaining position that could possibly take advantage of that. But, if it does turn around, then there’s an adjusted stop designed to mitigate the damage.
At this point we’ve already seen support responses at both 158.93 and 159.31 and I want to keep those on the chart in the event of a pullback ahead of the weekly close. Below that, and also relevant to near-term scenarios, is the prior swing high of 158.68.
If bulls can’t hold price above those three levels, then it’s the 157.50 psychological level and the 156.68-157.22 zone that stands out for deeper retracements.
USD/JPY Daily Chart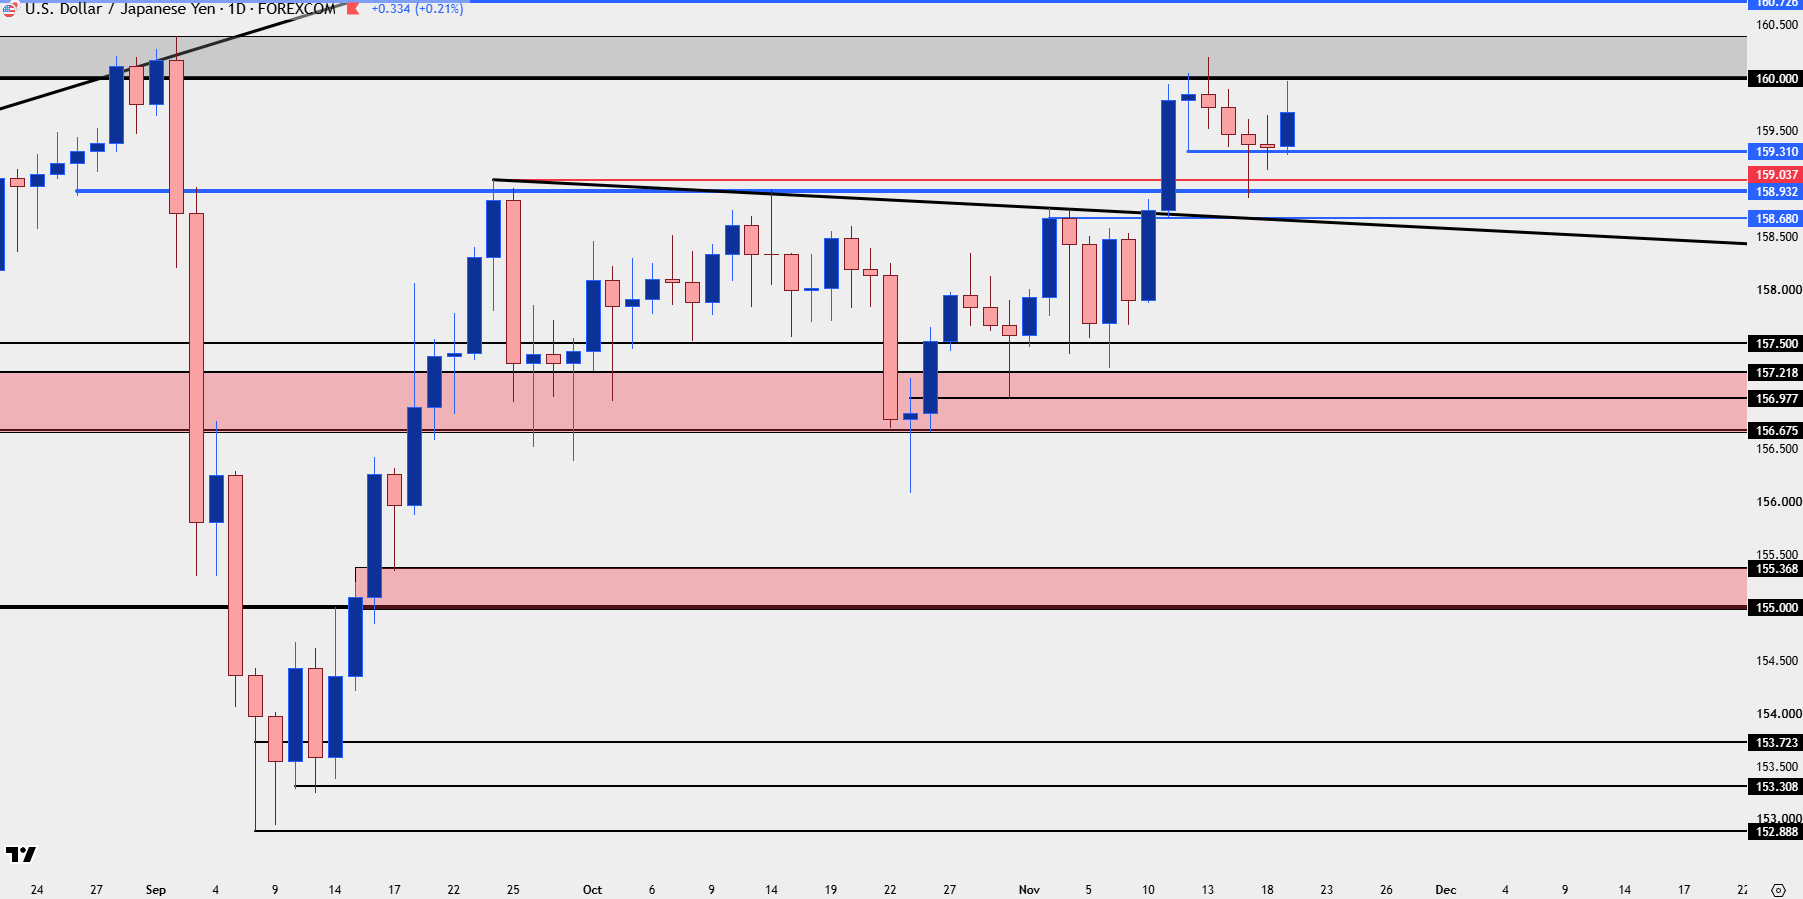
Chart prepared by James Stanley; data derived from Tradingview
--- written by James Stanley, Senior Market Analyst, Global Macro