
The US Dollar has set a fresh three-month high following the breakout from the ascending triangle formation. And, shorter-term, there’s now a support test at prior resistance of the 98.73 level. The bigger item is the prior resistance at the 97.94 Fibonacci level as this held the highs twice in February but was followed by higher-lows, which led into the breakout to begin this week.
US Dollar Four-Hour Chart
Chart prepared by James Stanley; data derived from Tradingview
USD Daily
From the daily chart it’s the 100.22 level that stands out as next resistance as this held three separate instances last year, including a double top formation in November that led to the broader breakdown into this year.
For that level to get taken out, especially anytime soon, it would seem we would need some type of black swan event and if that happened, I think the volatility response would be intense across other asset classes like stocks. But, for now, from the big picture, the move in macro has seemed rather tame, all factors considered, and this further supports the USD pullback thesis which then puts focus on USD pairs such as EUR/USD and GBP/USD for bounce setups.
US Dollar Daily Price Chart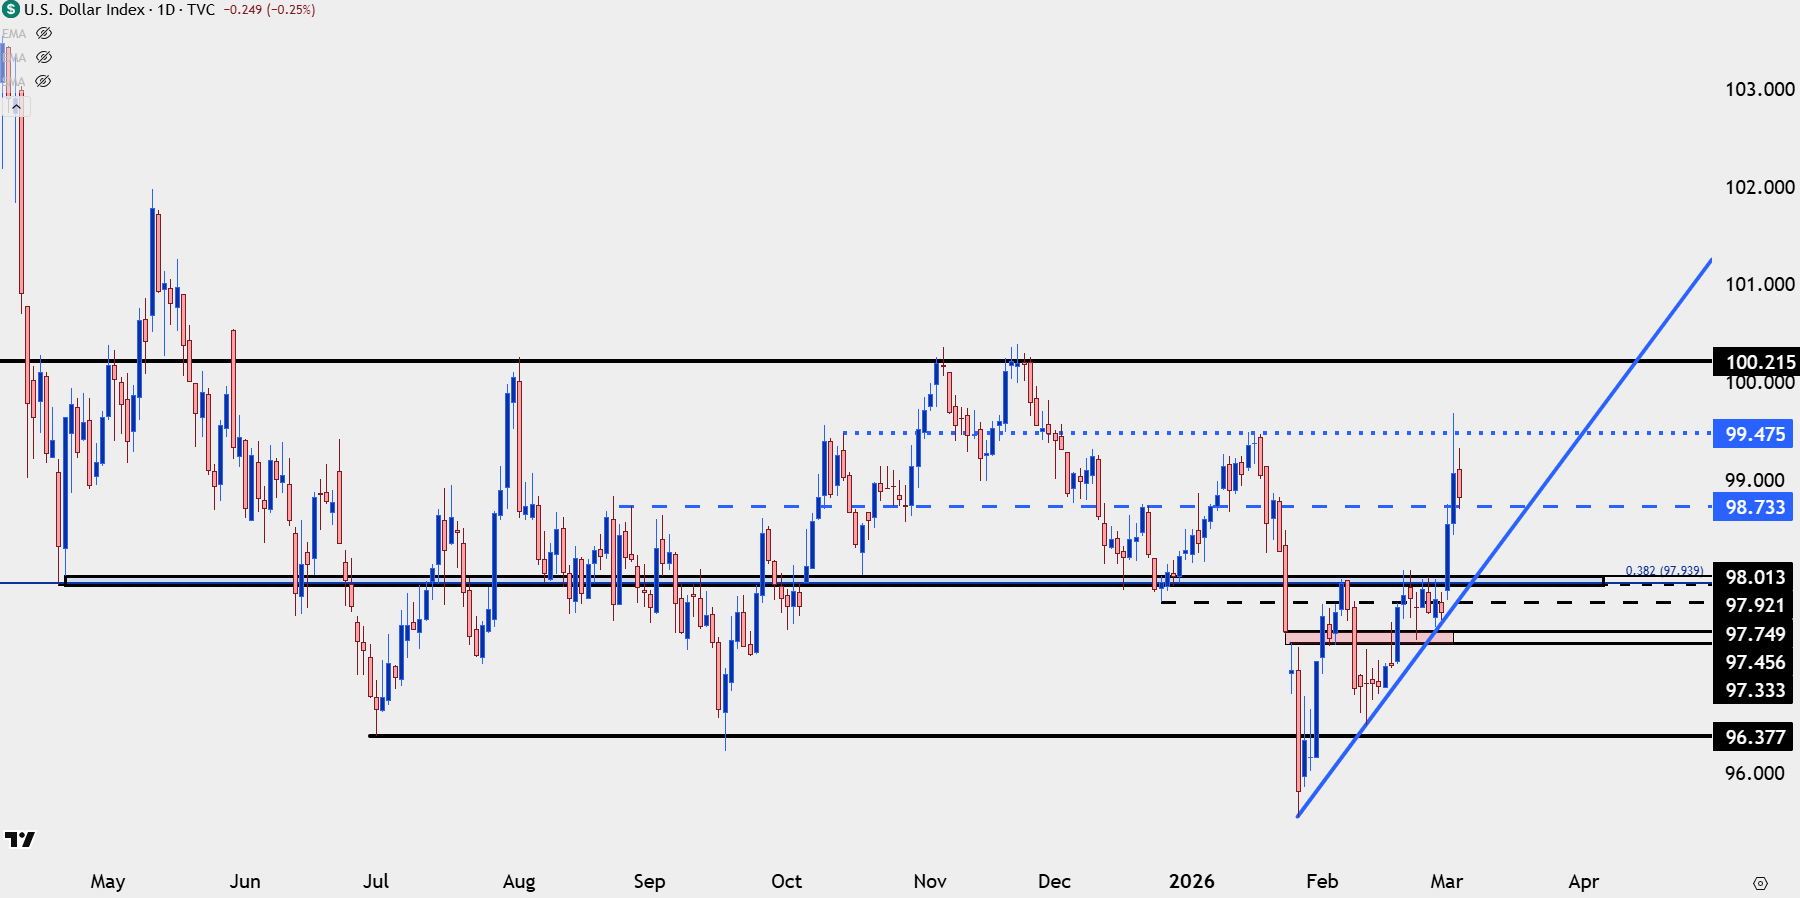
Chart prepared by James Stanley; data derived from Tradingview

EUR/USD
Perhaps the more interesting part about the early-week dynamics in the US Dollar is where it was coming from, as it was the EUR/USD breakdown that really seemed to drive the DXY breakout rather than a massive move in USD/JPY.
I do think there’s still some significant pull from USD/JPY, especially if we see weakness in the pair which I think could lead to the longer-term bullish positioning whittling down and that would have an impact on the DXY basket; but for this week’s strength, it was a notable breakdown in EUR/USD and the Euro is the larger component of the DXY basket at 57.6%.
But much like I had looked at with the USD breakdown in late-January, the big question here is whether sellers hit at lower-high resistance in effort of continuing the move. And like we saw in February, the next important item is whether bears can extend to fresh lows or whether they simply push down to a higher-low, which ends up leading to bullish reversal scenarios like we’re seeing play through in DXY right now.
For lower-high resistance potential on the daily EUR/USD, it’s the Fibonacci levels at 1.1686 and 1.1748 that stand out.
EUR/USD Four-Hour Chart
Chart prepared by James Stanley; data derived from Tradingview
GBP/USD
Cable has similarly bounced and it was the 1.3250 level that played in there, but we’re also closer to a possible spot of resistance so if looking to push the long side of the USD rally, this may be a more enticing backdrop for now. That resistance potential plays in from the prior low of 1.3434 down to the Fibonacci level at 1.3414.
GBP/USD Four-Hour Chart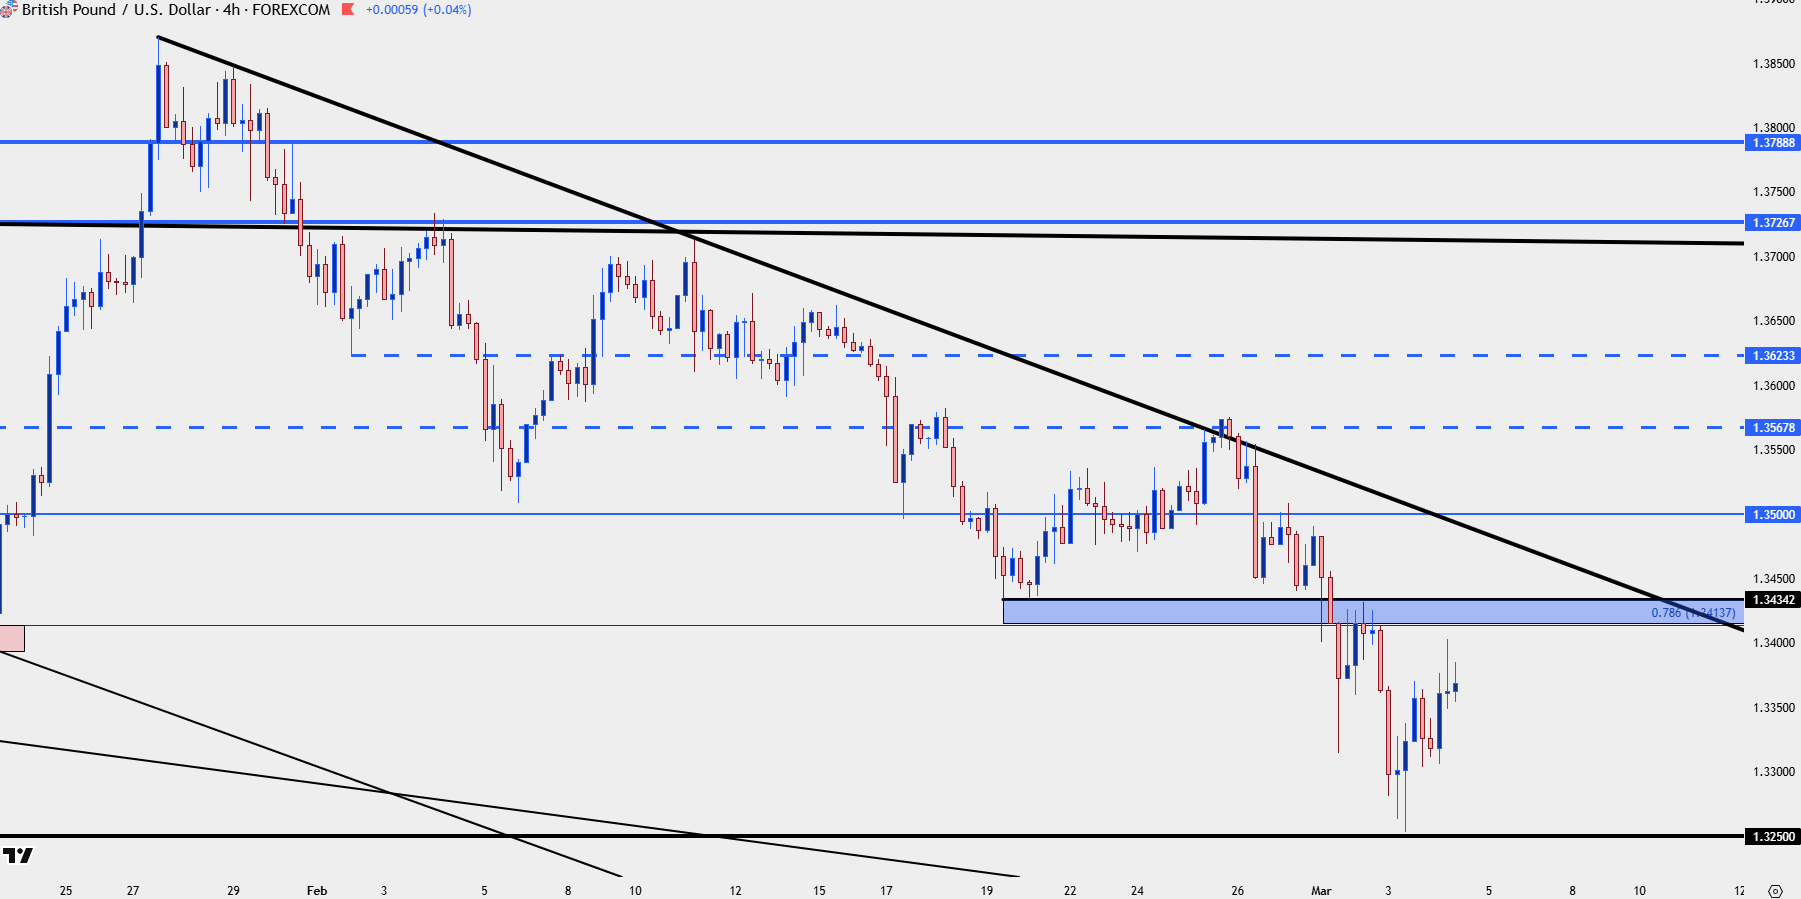
Chart prepared by James Stanley; data derived from Tradingview

USD/JPY
USD/JPY has so far held resistance and this remains a big push point for the US Dollar.
The challenge, however, is proximity to that 160.00 level, and we may even have a door opening to larger pullback themes as Kazuo Ueda highlighted how higher oil prices could lead to more inflationary pressure which would need to be countered by higher rates.
This is like the theme that prodded pullbacks in the pair in late-January and that had profound impact around the FX market, helping to even drive the EUR/USD break over the 1.2000 handle.
For now, short-term structure remains bullish and there’s 156.27 and the 154.45-155.00 zone that remains relevant for that. But – if bears can push below the 151.95-152.50 area that has so far held two vigorous support tests, we can be looking at change on the horizon very, very quickly.
USD/JPY Four-Hour Chart
Chart prepared by James Stanley; data derived from Tradingview
--- written by James Stanley, Senior Market Analyst, Global Macro