US Dollar Talking Points:
- US Dollar strength has continued today with the currency setting a fresh three-week-high. The next two days are incredibly important for this theme as tomorrow brings the release of Services PMI and Friday the release of Non-farm Payrolls.
- While the US Dollar was extremely weak in the first half of July, a pullback from fresh yearly lows has exposed a false breakout, and so far August trade has seen USD-strength as markets have grown more worrisome around Europe as European data has started to sour in response to the ECB rate hikes while US data has seemed to remain resilient. This puts emphasis on data releases for the next couple of days, with European Retail Sales set to be released on Friday morning, a few hours ahead of NFP.
- I’ll be discussing these themes in-depth in the weekly webinar on Tuesday at 1PM ET. It’s free for all to register: Click here to register.
We’re still in the very early stages of August trade but so far, the US Dollar has continued the same trend that held through the end of July trade. It wasn’t like that for all last month, however, as an aggressive bearish breakdown showed around the release of US CPI in the first half of July, helping to prod the USD down to a fresh yearly low.
But what started as a pullback in a bearish trend has now taken on a bit more strength as buyers have continued to push, and along the way another theme has appeared as European data has taken a turn for the worse. This is relevant to the Dollar and was on full display last week, particularly on Thursday morning after the FOMC rate decision. That was the morning of the European Central Bank rate decision and it’s also the morning that we got a strong read out of the US in the form of both GDP and Durable Goods.
That outlay highlighted the growing divergence in trends behind US and European economic data. Last week started with a series of disappointing PMI prints out of Europe and given the leading quality that’s often associated with PMI prints, this produced a bit of worry. But it was the Tuesday release of bank lending data that really started to get attention as it showed a marked decline in European loan activity, suggesting that the toll from ECB rate hikes has begun to show.
On Thursday, at the ECB rate decision, Christine Lagarde sounded more dovish than she has in a long time and this seems to have a tie to that worsening economic data out of Europe. Meanwhile, in the US, the Federal Reserve struck a tone of ‘data dependency’ at the last rate decision, which had an initial dovish take from markets as evidenced by the bearish response to the USD.
But, the next morning, in between the ECB’s rate announcement at 8:15 and press conference at 8:45, US GDP was released to a resounding beat and Durable Good showed a strong read against the expectation, as well. Collectively, those factors both contributed to a strong downside push from bears. I had investigated that outlay in the article from the day, and there’s been continuation in those themes since.
I spent a large portion of yesterday’s webinar discussing this theme as the data set to be released later this week could serve as a strong control point for both themes of USD strength and EUR/USD weakness. Tomorrow morning we get the Services PMI print out of the US, and much like we saw out of Europe last week, this indicator can be read by markets with a bit of expectation as it’s often considered a leading variable. And then the next morning, we get the NFP report for the month of July.
And if that data remains strong, this could further push themes of USD-strength as markets increase expectations for another rate hike out of the FOMC by the end of this year.
From the weekly chart below, we can see this theme on display as the USD has built a falling wedge formation so far in 2023 trade. These formations are often approached with the aim of bullish breakouts, but buyers may have their work cut out for them as the upper trendline for the formation has already held multiple pushes from bulls but, as yet, hasn’t given way.
US Dollar - DXY Weekly Price Chart (indicative only, not available on Forex.com platforms)
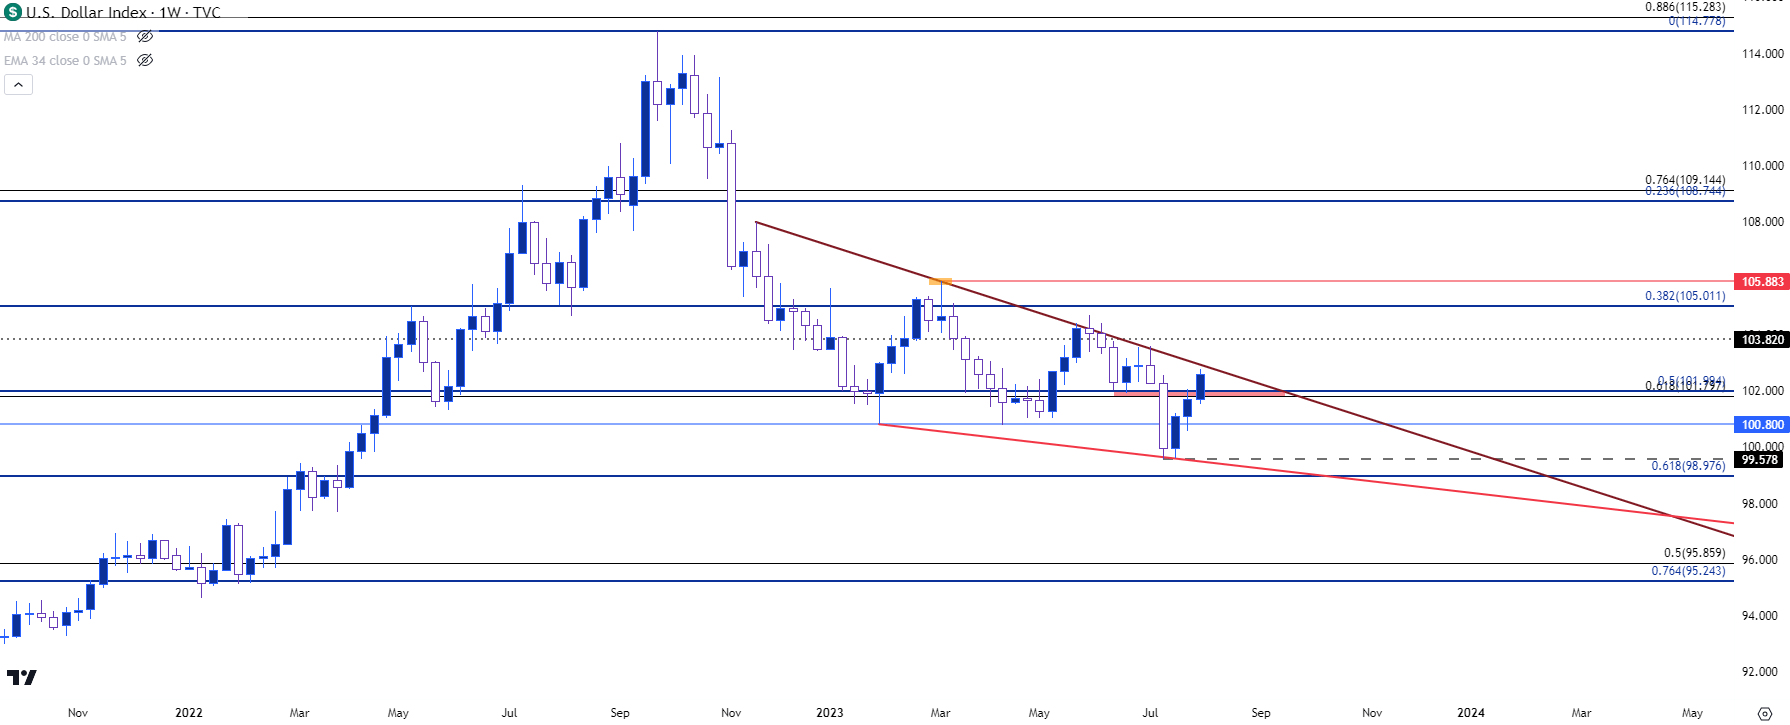 Chart prepared by James Stanley; data derived from Tradingview
USD Trendline Tango
From the daily chart below, we can see just how resistance that upper trendline has been so far this year. The inflection in late-May and early-June saw quite a bit of persistence from bulls but they were seemingly unable to leave that trendline behind. The corresponding pullback ran down to a key spot, around 102, and that helped to set the June low.
But when price jumped back up to the trendline in early-July, it was a quick kiss that the level before sellers went on the attack and, eventually, broke the yearly low at the 100.80-101 handle. The move didn’t stall at the psychological level of 100, either, as sellers continued to push.
But, as I had said in the webinar on the Tuesday after the break, the big test for the trend would be rather bears showed up to hold resistance at a lower-high. That hasn’t happened yet, as bulls have just continued to push, and as looked at yesterday the USD was showing a bullish trend with higher-low support potential around that same 102 level that helped to set the June low.
The USD has since bounced from that support test up to another fresh three-week-high, setting the stage for a re-test of the vaulted trendline that, so far, has not wanted to give way.
US Dollar - DXY Four-Hour Price Chart (indicative only, not available on Forex.com platforms)
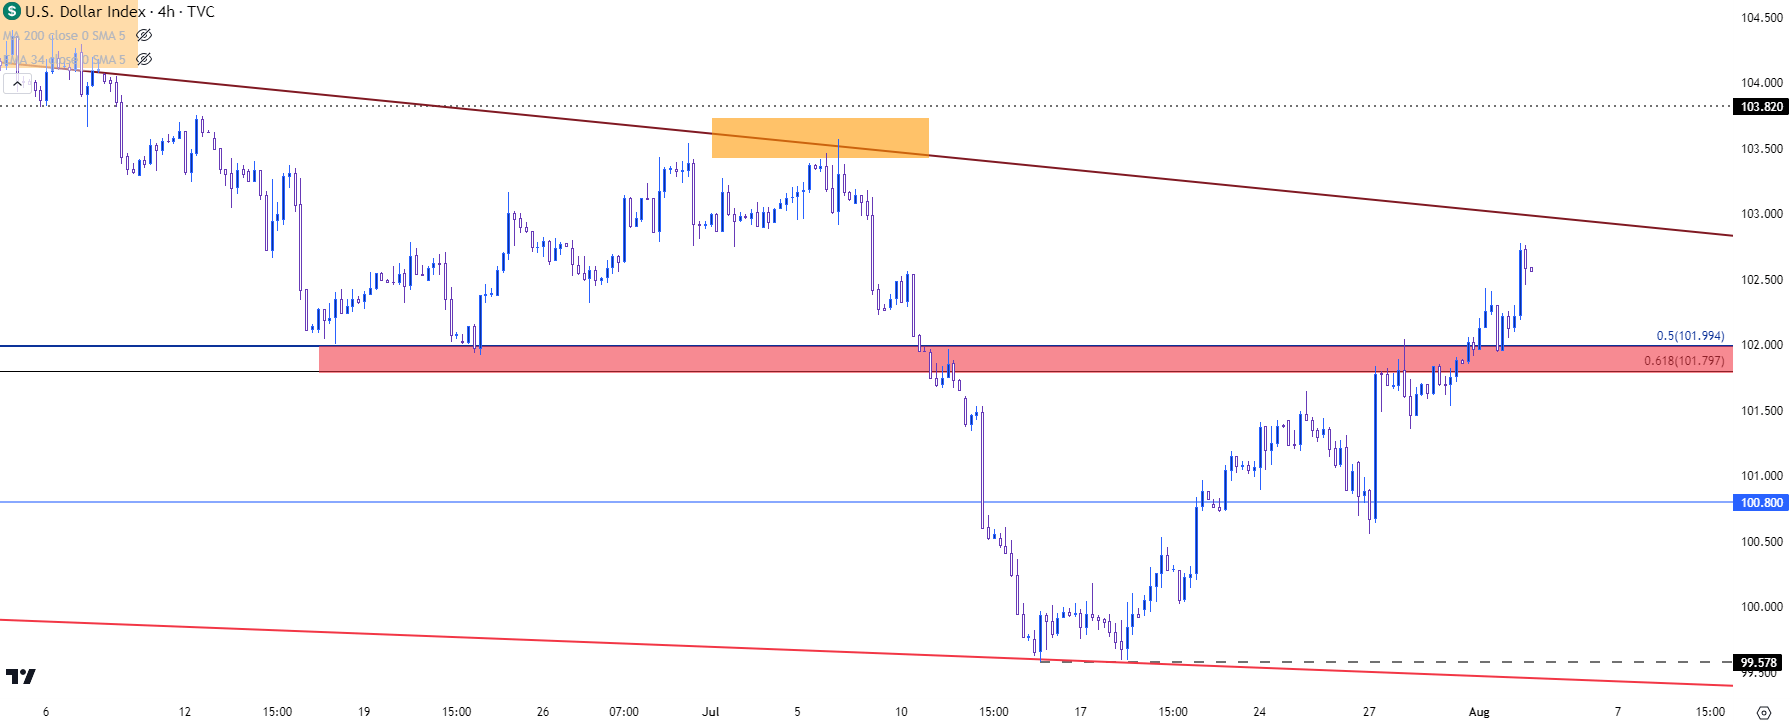 Chart prepared by James Stanley; data derived from Tradingview
USD Levels
If bulls can finally force a breakout beyond that trendline, the next level of resistance that I’m tracking is around 103.82 with the 105 handle after that. On the support side, 101.80-102 could come back into the picture as this did slow the recent bullish advance but, hasn’t yet been tested much for support since price has re-ascended above that level.
US Dollar - DXY Daily Price Chart (indicative only, not available on Forex.com platforms)
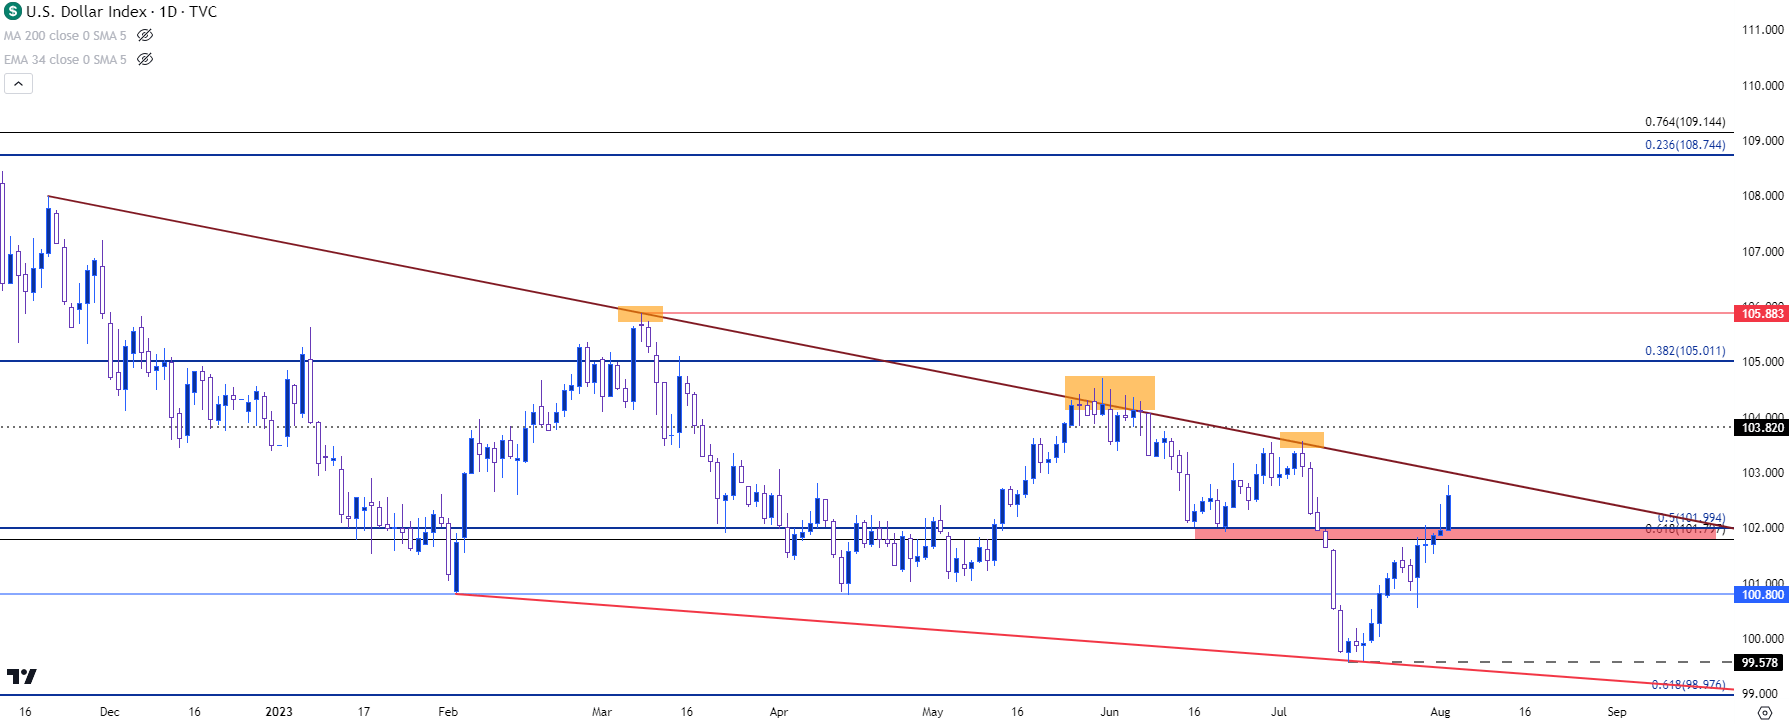 Chart prepared by James Stanley; data derived from Tradingview
EUR/USD Breakdown Potential
The Euro makes up a whopping 57.6% of the DXY quote so the two markets can often display mirror image themes. And as we look at the recent bullish trend in the USD, there’s been a strong bearish push in EUR/USD and the pair is holding at a key level of support, as of this writing.
This is the same 1.0943 level that I discussed last week and it quickly came into play on Friday, helping to build a bounce. But that bounce was only able to run up to resistance at prior support of 1.1033 (this was also the February swing high), and bears have come right back to the table to push price right back to support.
As looked at in late-July, this fast reversal after a failure to hold the breakout gives the appearance of a false breakout along with bearish reversal potential.
The next spot of support could have a bearing on the matter, as the region around 1.0845 held multiple inflections late last month before bulls were able to force back above 1.1000. If sellers can take that zone out by the end of this week, bearish themes in EUR/USD will take on even more attraction as that bigger picture false breakout/reversal theme will look more prominent.
EUR/USD Daily Price Chart
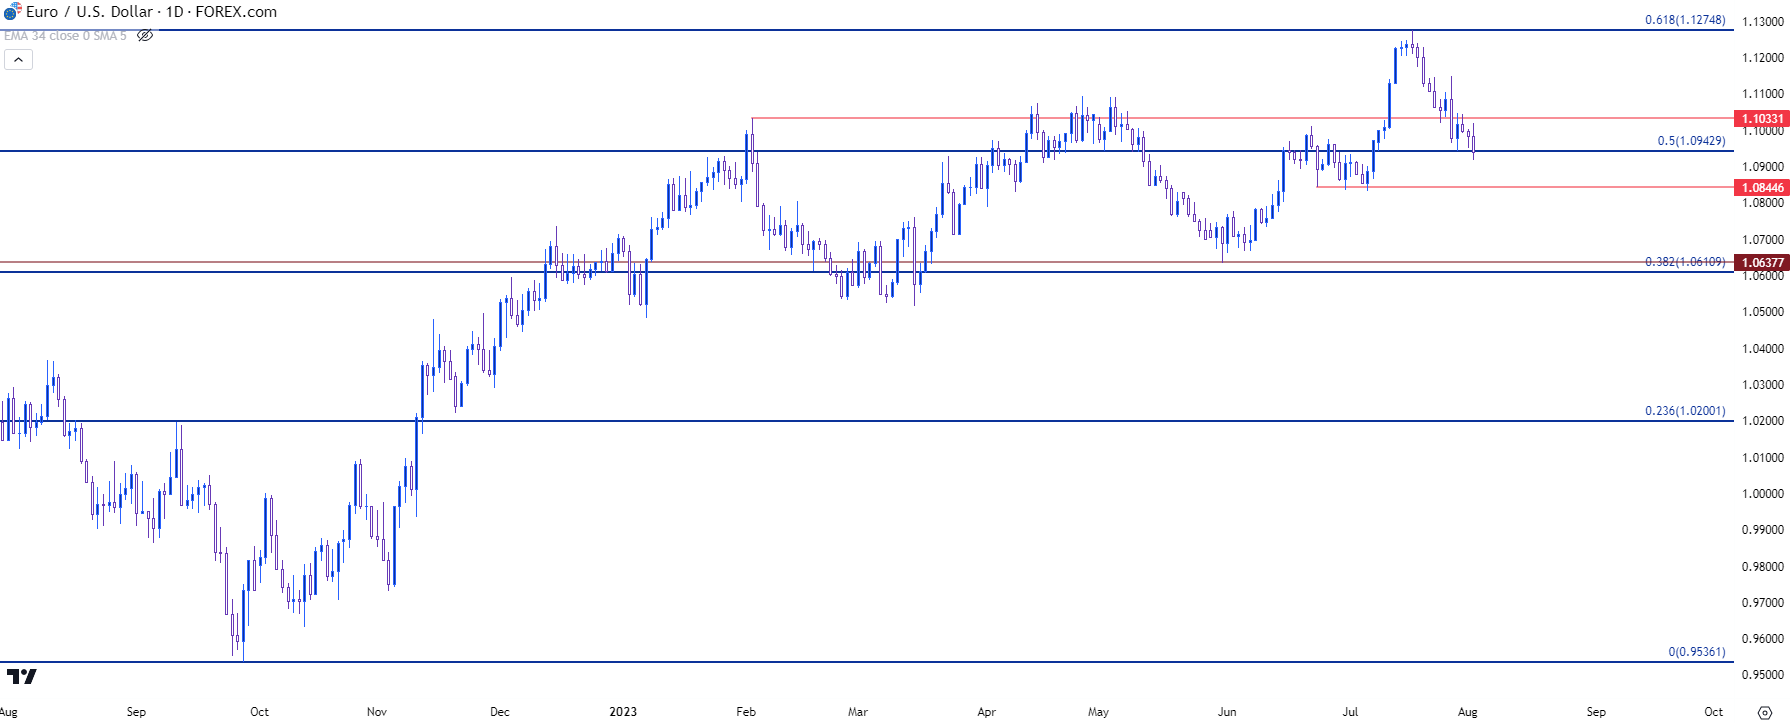 Chart prepared by James Stanley, EUR/USD on Tradingview
--- written by James Stanley, Senior Strategist