
The week begins with a bias in favor of the Canadian dollar, which has appreciated by around 0.25% against the U.S. dollar. This move comes as markets anticipate the release of inflation data in Canada, scheduled for tomorrow. Selling pressure on USD/CAD remains steady, as the behavior of the CPI will be key for the Bank of Canada’s (BoC) monetary policy decisions. If the market interprets that the institution may shift away from its lower-rates stance, selling pressure on the pair could intensify in the coming sessions.

What to Expect from Canada’s CPI?
The annual inflation data will be released tomorrow, with forecasts pointing to around 2.0%, compared to 1.7% in July. A result in line with expectations would reinforce the perception that Canada is staying close to the official 2.0% target, but a higher figure could trigger alarms. If CPI remains consistently above this threshold, it would put an end to the neutrality seen in recent months and open the door to a more aggressive inflationary trend, considered risky for the economy.
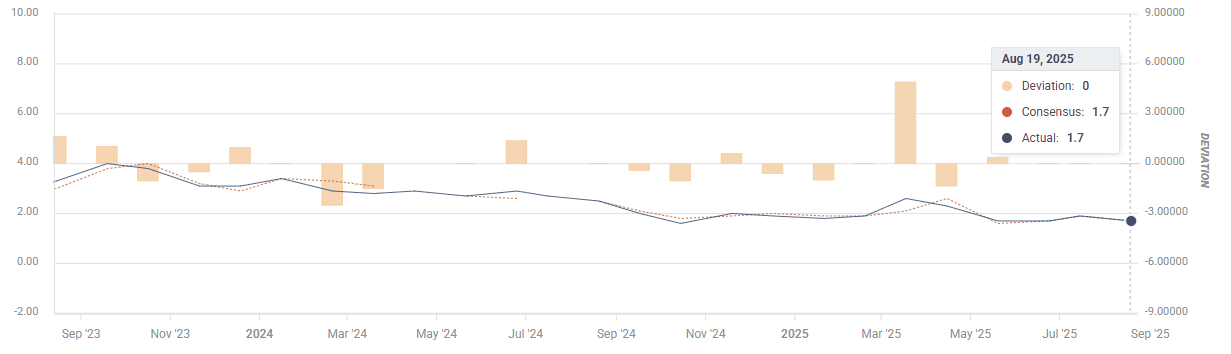
Source: FxStreet
The Bank of Canada is scheduled to announce its rate decision on September 17, and markets largely expect a 0.25% cut, which would lower the benchmark from 2.75%. This expectation is based on signs of economic weakness: GDP contracted -1.6% in Q2, more than forecast, and unemployment rose to 7.1% in August, the highest since the pandemic.
However, the BoC Governor has emphasized that cuts depend on two factors: persistent economic weakness and continued easing of inflation. If either of these conditions fails, the strategy of lower rates could be questioned. That’s why tomorrow’s inflation data is so important: a higher-than-expected reading could complicate not only this week’s decision but also the monetary policy outlook for the rest of 2025.
In such a case, the central bank would face a dilemma: continue cutting rates to support the economy or pause stimulus to prevent an inflation rebound. If the first option prevails, the CAD could lose appeal, weakening demand for Canadian assets. If the second scenario takes hold, the selling pressure observed in USD/CAD at the start of the week could extend further.
What About Both Central Banks?
This week also brings policy decisions from the Federal Reserve, highlighting the divergence between the two central banks. Currently, the U.S. maintains rates at 4.5%, while Canada stands at 2.75%. This 175-basis-point gap consistently favors U.S. dollar-denominated assets, compared to Canadian bonds and securities, which are less attractive.

Source: TradingEconomics
Even if both the Fed and the BoC announce 0.25% cuts, the differential will continue to benefit the U.S. in the short term, since its benchmark rate remains significantly higher. If Canada persists with its low-rate policy for the remainder of the year, the gap will remain, reducing the appeal of CAD-denominated assets while strengthening positioning in U.S. dollars.
In this context, the selling pressure currently seen on USD/CAD could prove temporary, with the broader outlook favoring buying pressure on the pair as long as the rate differential persists.
USD/CAD Technical Outlook

Source: StoneX, Tradingview
- Possible New Trend: Since late July, USD/CAD had been forming higher lows, shaping a potential short-term uptrend. However, the recent pullback has tested this structure. If selling pressure persists, the trend could break, giving way to a more bearish bias in the short term. This makes it important to closely monitor price action in the coming sessions.
- RSI: The RSI is hovering near the neutral 50 level, marking a decisive point. A break below would confirm that selling impulses have taken control over the last 14 sessions, increasing the likelihood of stronger downside pressure.
- MACD: The MACD shows a similar scenario, with its histogram registering slightly below the zero line, signaling that short-term bearish momentum is gaining ground against moving averages and raising the risk of a shift into negative territory.
Key Levels:
- 1.37652 – Crucial Support: Aligns with the 50-period simple moving average and the Ichimoku cloud. A break below would jeopardize the current bullish trendline and potentially activate a stronger bearish bias.
- 1.39263 – Immediate Resistance: Corresponds to the 38.2% Fibonacci retracement. A move up to this level could reignite buying interest and strengthen the short-term uptrend.
- 1.40226 – Key Resistance: Aligned with the 200-period simple moving average, it is the most important upside barrier. A firm breakout here would confirm a more consistent bullish trend with potential to extend for several weeks.
Written by Julian Pineda, CFA – Market Analyst
Follow him: @julianpineda25