
As the trading week continues, USD/JPY price action has begun to show a notable shift in tone in the short term, with the pair posting a decline of more than 0.8% in favor of the yen during the session. This has started to bring a renewed bearish bias into the pair’s movements.
Selling pressure is being driven, in part, by the loss of demand for the U.S. dollar, following the easing of tensions in the Middle East. This has allowed the yen to regain ground in the short term. If this dynamic continues, downward pressure could remain relevant in USD/JPY over the coming sessions.

Demand for dollars begins to ease
Yesterday’s session was particularly relevant for market risk sentiment, as fear began to moderate following comments from Trump pointing to a temporary ceasefire of around two weeks. While this is not a definitive agreement, it is being interpreted as a pause for negotiations.
In addition, Iran has started to restore maritime traffic through the Strait of Hormuz, which has helped reduce immediate concerns over global oil supply. This has led to a decline in overall risk perception, which had been elevated in previous weeks.
This development has been particularly negative for the U.S. dollar, which had been acting as the primary safe-haven asset during the escalation of tensions. As the situation begins to ease, the need to hold dollars as a hedge has diminished in the short term.
This effect is already visible in the DXY index, which has shown a downward move from the 100 level toward the 98 area, indicating a loss of demand momentum during the latest session.
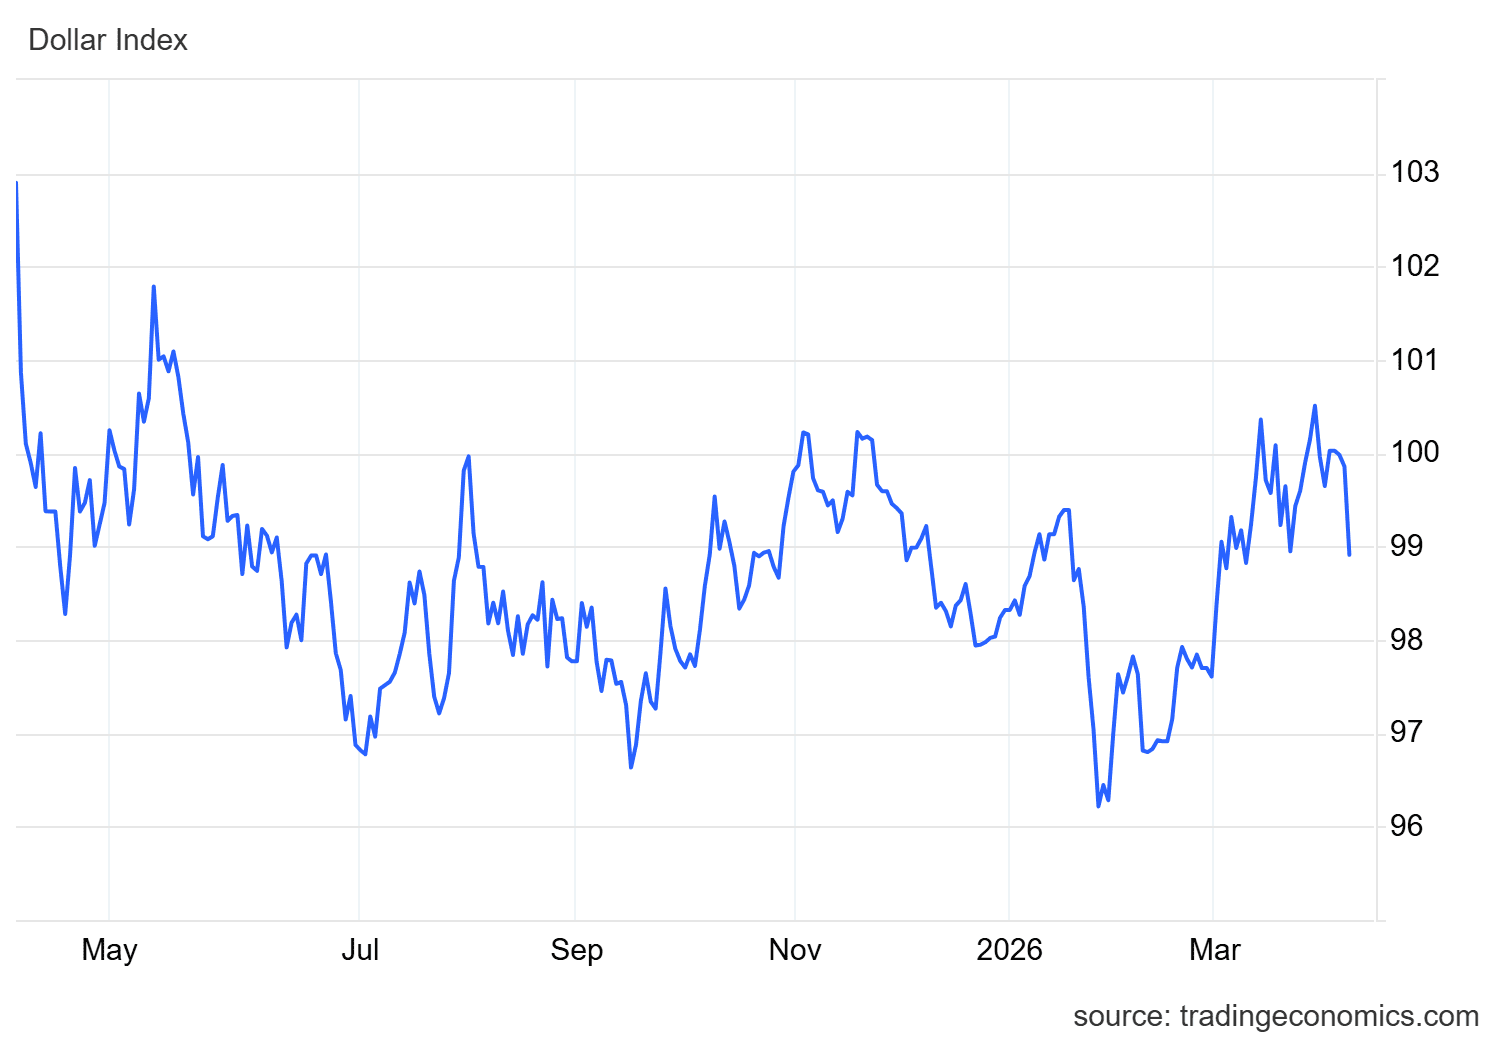
Source: TradingEconomics
This behavior is important, as the weakening of the dollar has allowed currencies such as the Japanese yen to strengthen, explaining the recent movements in USD/JPY. As long as this dollar weakness persists, selling pressure is likely to remain part of the pair’s short-term dynamics.
Can the interest rate outlook still matter?
At present, it is important to consider that U.S. interest rates, currently around 3.75%, remain significantly higher than those in Japan, which are near 0.75%. This rate differential has historically supported greater attractiveness in dollar-denominated assets over the yen in the long term.
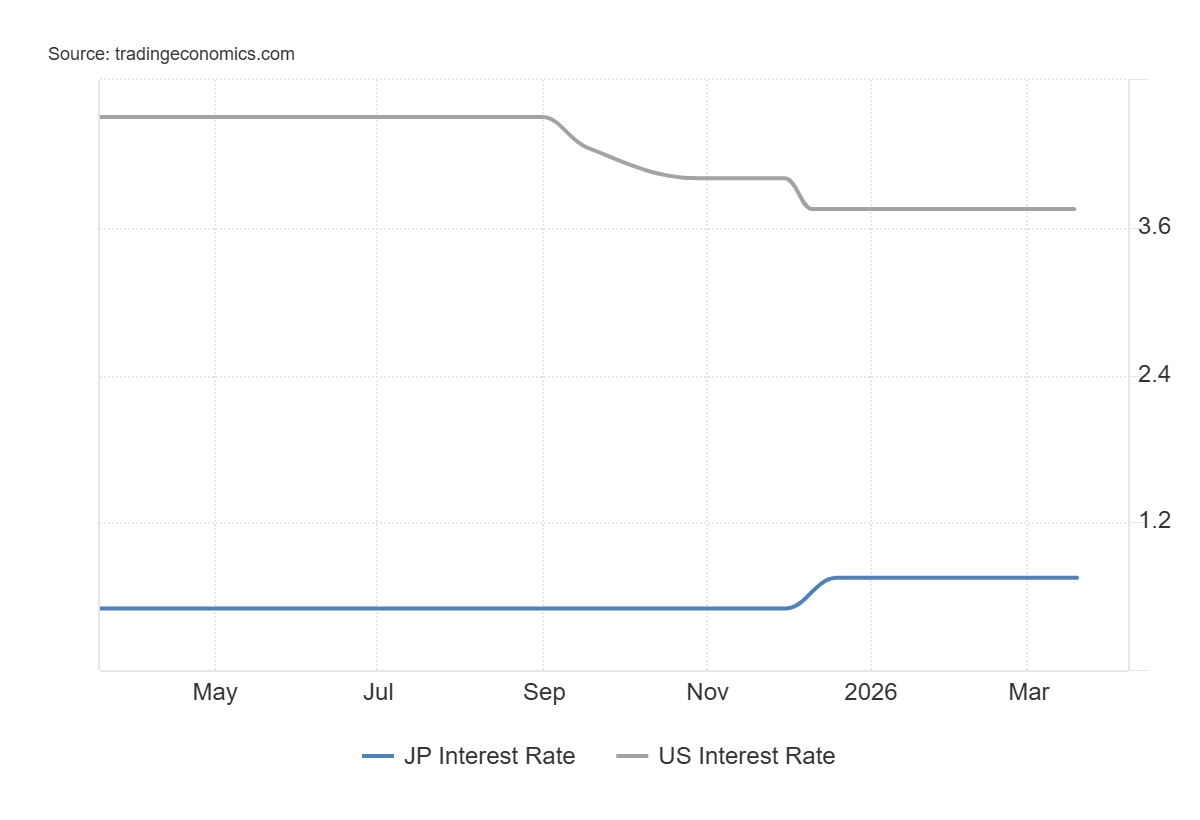
Source: TradingEconomics
Market expectations suggest that the Bank of Japan will maintain its policy unchanged in upcoming decisions, while, according to CME Group data, there is a 98.4% probability that the Federal Reserve will also keep rates unchanged in its next meeting.
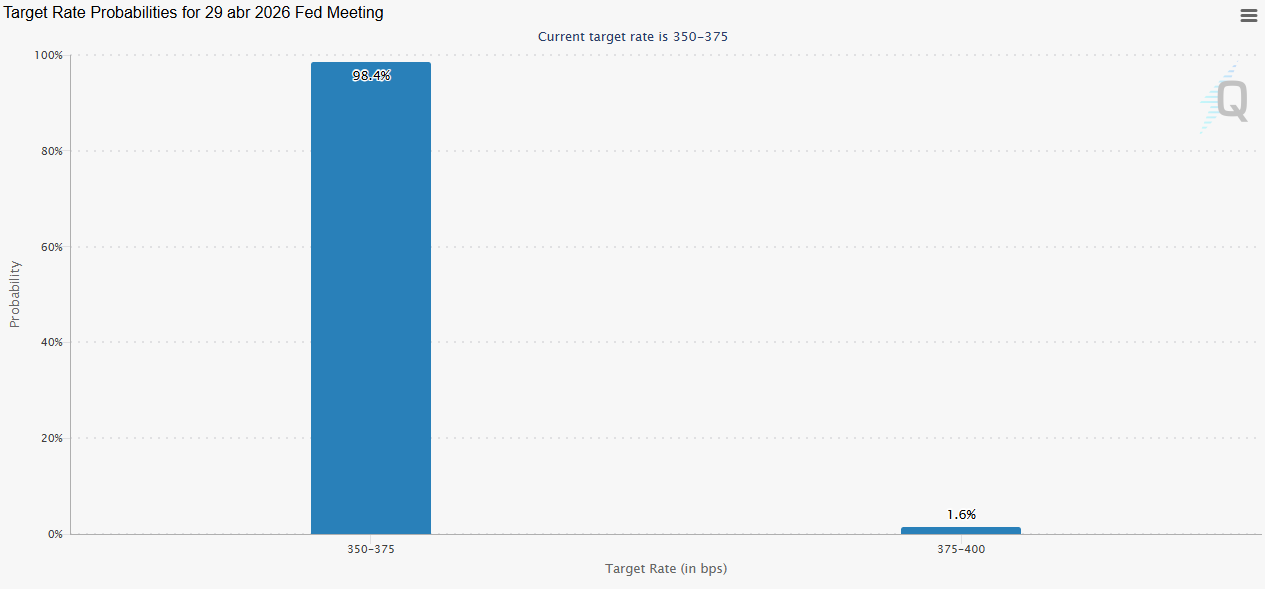
Source: CMEGROUP
This suggests that the interest rate differential will remain in place in the short term, limiting the yen’s upside potential in the medium term, despite its recent recovery. Over time, this could once again support a renewed bullish bias in USD/JPY at broader time horizons.
USD/JPY Technical Outlook
Source: StoneX, Tradingview
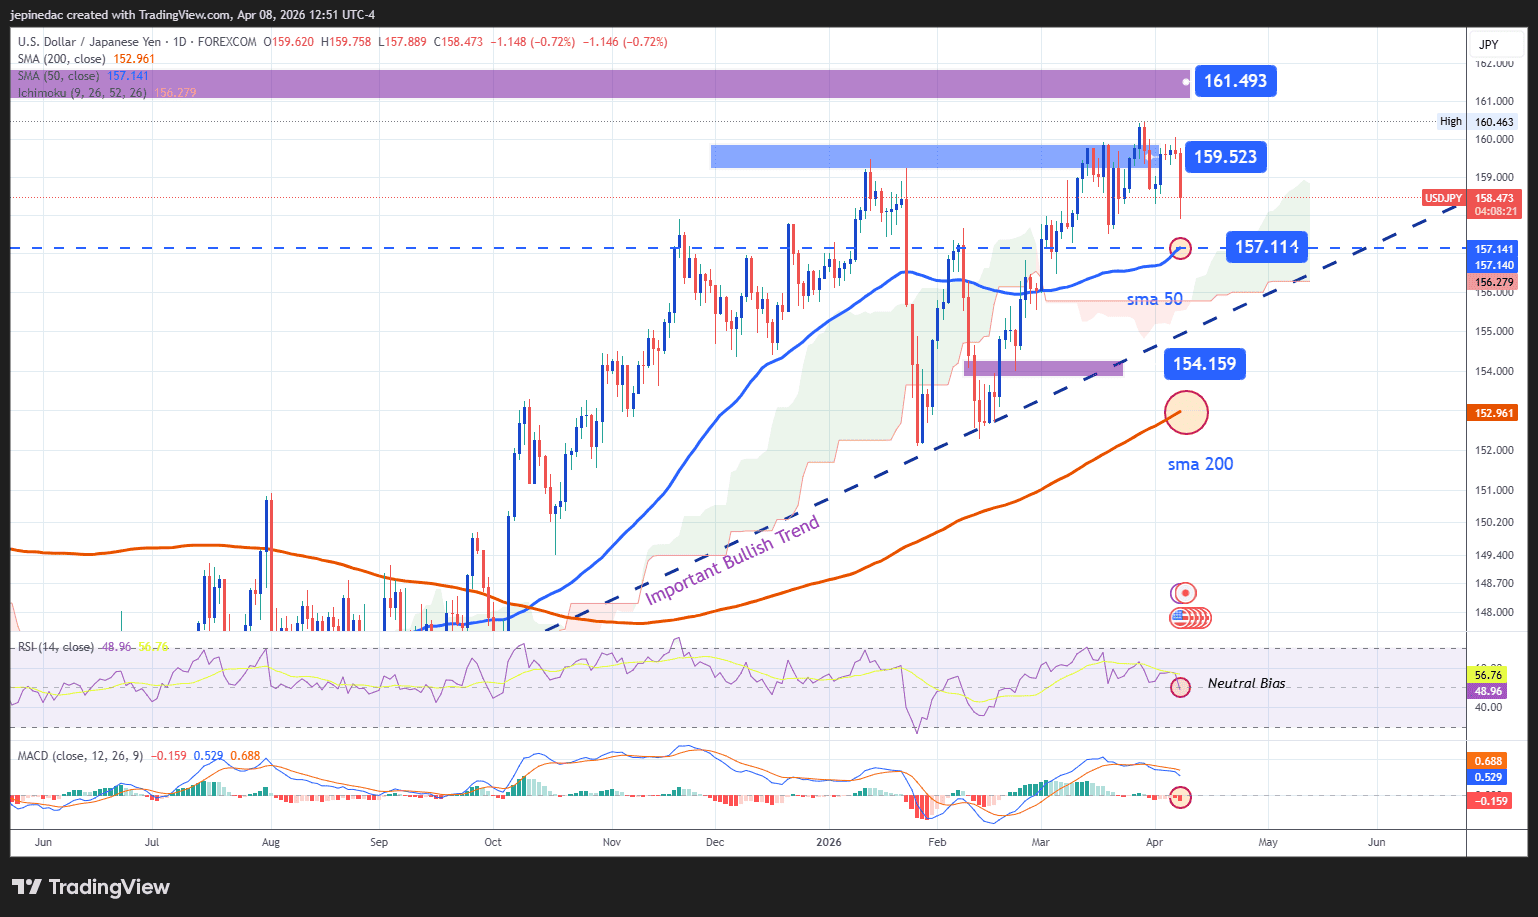
- Long-term uptrend remains dominant: Despite recent declines in USD/JPY, the daily chart continues to be dominated by a long-term upward trendline, which has been in place for several months. So far, bearish corrections have not been strong enough to challenge this structure, meaning it remains the primary technical reference for price action in the near term.
- RSI: The indicator continues to fluctuate near the 50 neutral level, suggesting a balance between buying and selling momentum in the short term. This behavior may indicate a phase of indecision, which could remain relevant in the coming sessions.
- MACD: The MACD shows a similar picture, with the histogram hovering around the zero line, reflecting a balance in short-term moving average momentum and reinforcing the lack of a clear directional bias.
Key levels:
- 161.493 – Key resistance: A level not seen since 2024, acting as a major upside barrier. A move toward this zone could confirm a stronger bullish bias and support continuation of the uptrend in the coming weeks.
- 159.523 – Near-term barrier: A key neutral zone. Price action around this level could increase the indecision bias in the chart and reinforce a range-bound or indecisive scenario in the short term.
- 157.111 – Key support: A level aligned with the 50-period moving average. A break below this zone could trigger a more consistent bearish bias and begin to challenge the long-term uptrend.
Written by Julian Pineda, CFA, CMT – Market Analyst
Follow him on: @julianpineda25