
Near the end of the trading week, one of the most relevant moves in the FX market has been the Japanese yen’s neutrality, even after the release of the US PCE inflation data. After the data was published, USD/JPY did not register a significant move, with price action staying close to 0.05%, reinforcing a phase of short-term indecision.
This behavior reflects a combination of factors. On one hand, the yen has still not shown a clear recovery. On the other, the US dollar has entered a pause after several sessions of strength. Under this scenario, neutrality could continue to shape USD/JPY price action over the next few sessions.

US PCE data is released
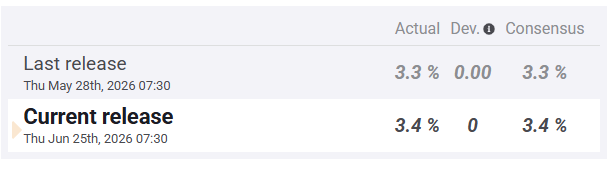
During the session, the United States published its Core PCE data, an indicator that measures changes in prices paid by consumers while excluding food and energy. The figure came in line with expectations at 3.4%, slightly above the previous 3.3% reading.
Although the release did not bring a major surprise for the market, it does confirm that inflationary pressures remain present in the US economy. This has brought some calm to expectations of higher rates, but it does not remove the underlying issue: inflation has still not shown a clear enough slowdown during 2026.
Source: FXSTREET
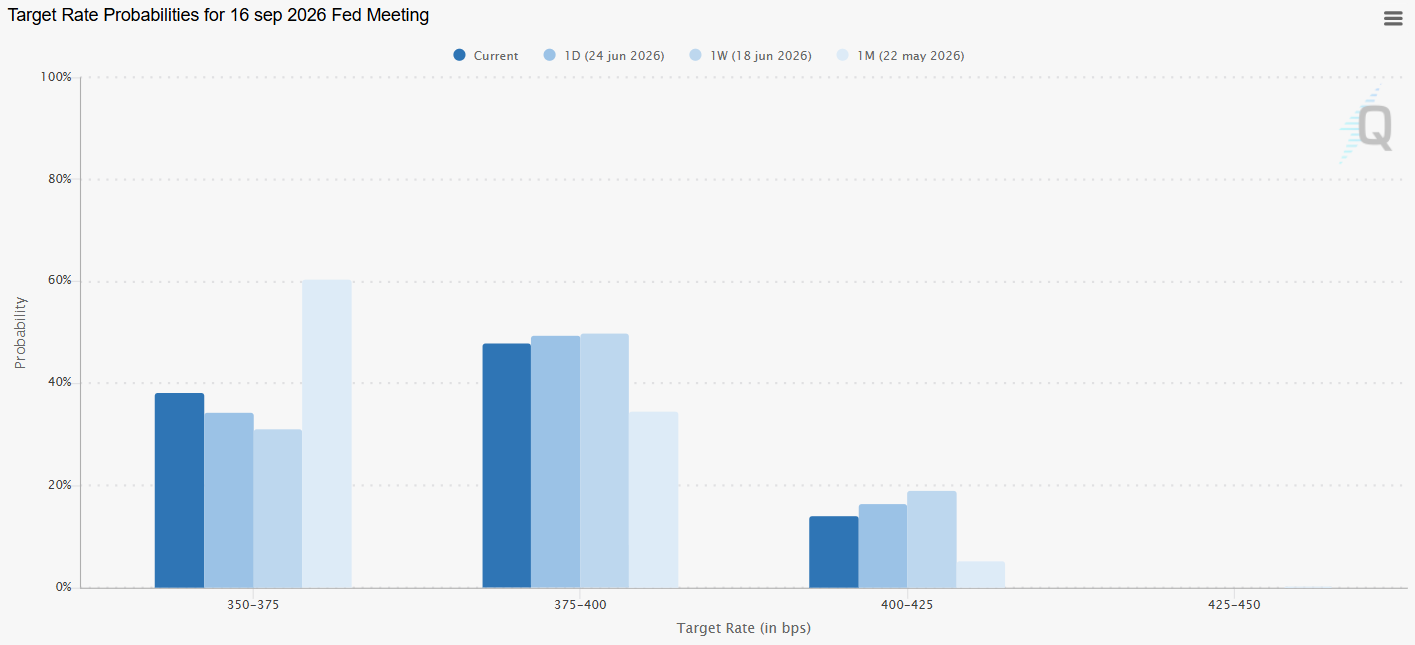
Even though the US dollar has lost some strength after the in-line data, the Federal Reserve outlook has not changed significantly. The CME Group probability table continues to show a relevant expectation of higher rates for September. After the PCE release, the probability of a rate hike moved from 49.32% to 47.80%, a moderate decline that does not fully change the scenario for the dollar.
For now, this adjustment has not been enough to meaningfully change confidence in the USD, as the market still sees a rate hike as possible over the next few months.
Source: CMEGROUP
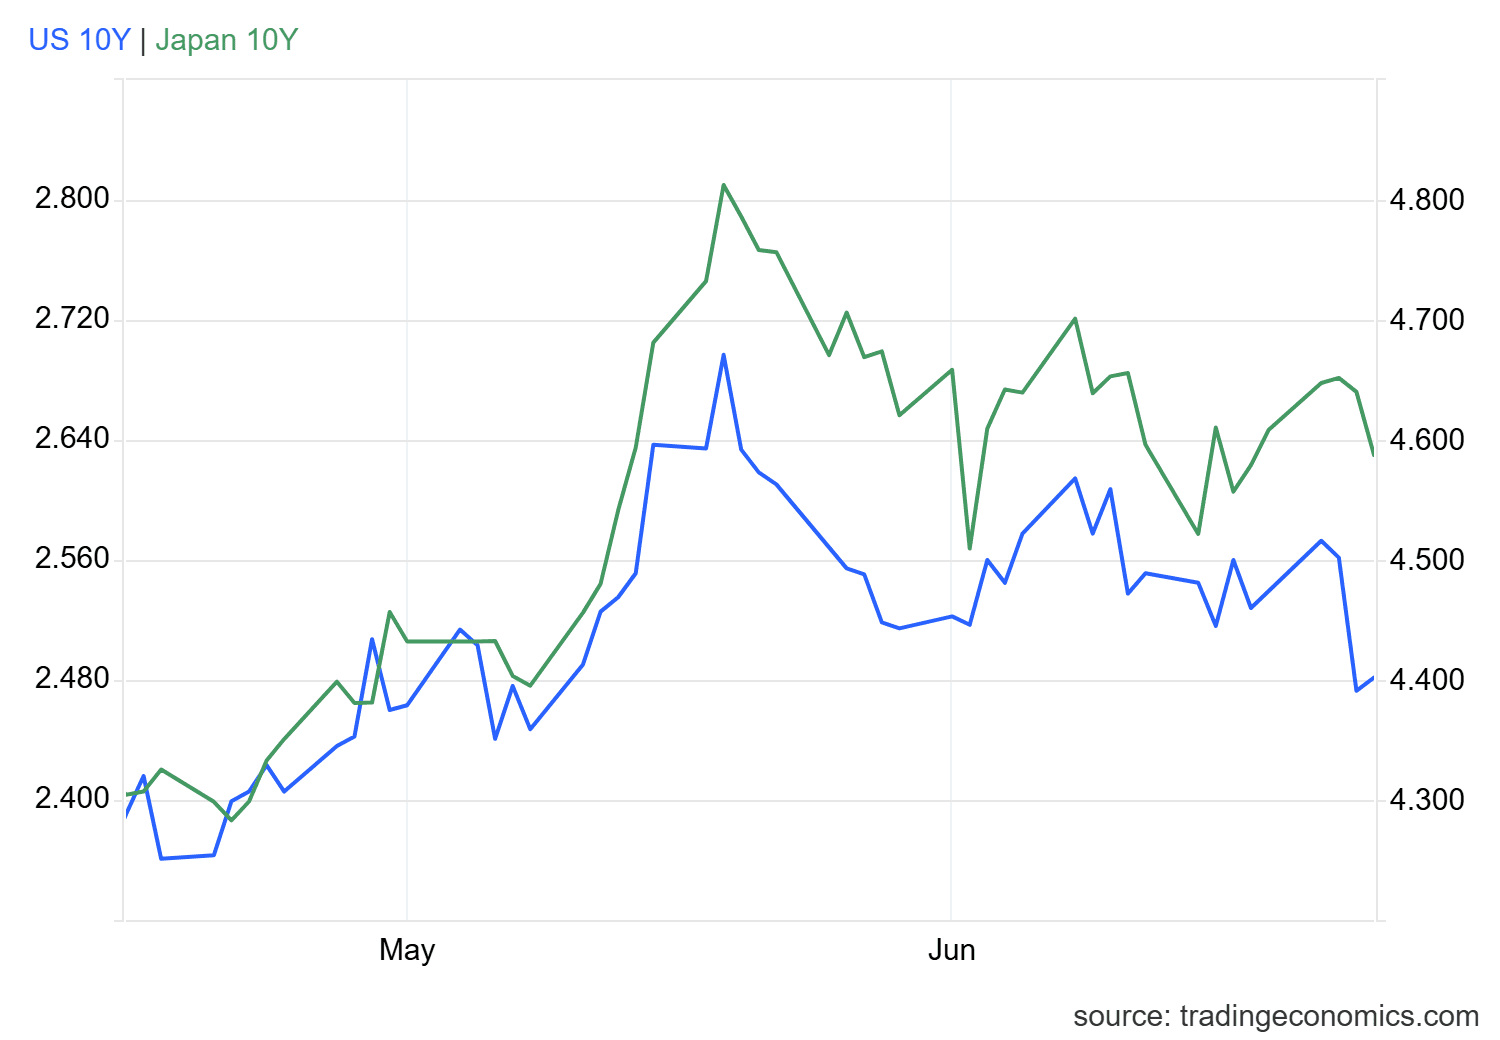
When comparing the US and Japanese bond markets, the rate differential remains an important factor. Although the US 10-year Treasury yield has pulled back toward the 4.4% area, Japanese 10-year bonds have also declined toward 2.6%. This keeps a wide gap between both markets and continues to support the appeal of dollar-denominated assets.
For this reason, recent economic data and the slight easing in US yields have not been enough to generate a meaningful shift in demand for the Japanese yen.
Source: TradingEconomics
Part of this difference also comes from the lack of clarity around the Bank of Japan. Although the institution has raised its benchmark rate to the 1.00% area, it is still unclear whether this process will continue at the late-July decision. In contrast, the Federal Reserve maintains a higher-rate outlook, which continues to support a more attractive bond market in the United States.
As long as this difference remains in place, the rate differential could continue to work against the Japanese yen and in favor of the US dollar. This could keep buying pressure in USD/JPY relevant over the next few weeks of trading.
Technical outlook for USD/JPY
Source: StoneX, Tradingview
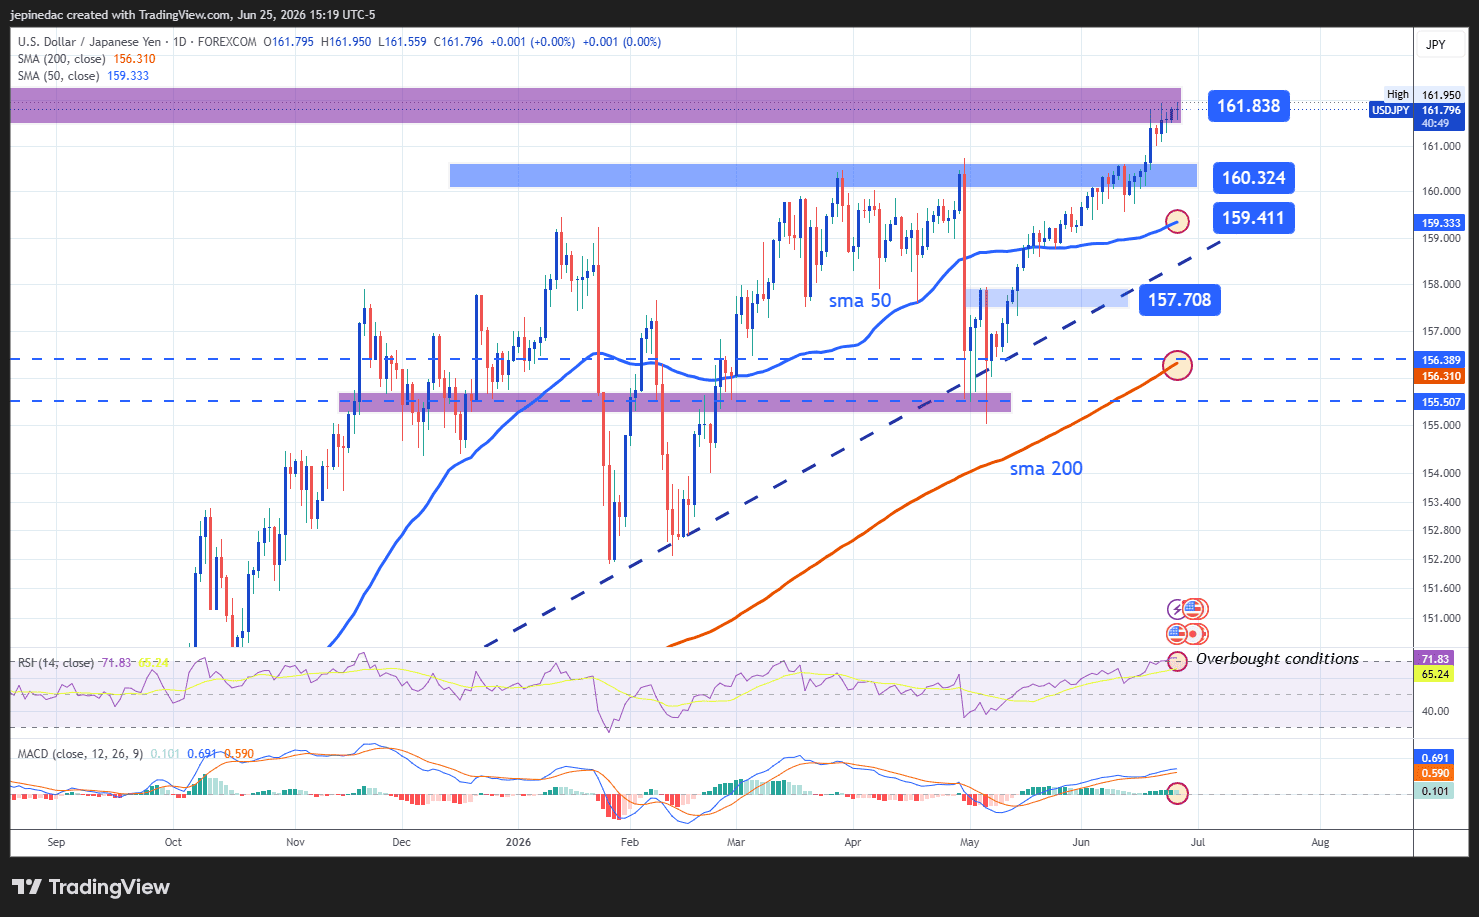
- The bullish trend remains dominant: For several months, the most important technical structure in USD/JPY has been a long-term bullish trendline. So far, the lack of deep bearish corrections has allowed this structure to remain the dominant pattern. If selling pressure fails to consolidate over the next few sessions, the bullish trend could continue to extend. However, the recent loss of buying momentum could also open the door to short-term bearish corrections.
- RSI: The RSI remains above the 50 neutral area, indicating that buying impulses are still relevant. However, the indicator is also above the 70 overbought zone, which suggests excess bullish strength and could open the door to short-term bearish corrections.
- MACD: The MACD histogram remains above the 0 line, showing that short-term moving averages still favor a bullish bias. As long as this dynamic continues, buying pressure could remain relevant on the USD/JPY chart.
Key levels:
- 161.838 – Key resistance: This level is linked to the 2024 highs and is currently the most important upside barrier. Sustained moves above this point could mark new relevant highs and reinforce the buying bias over the coming weeks.
- 160.324 – Nearby barrier: This recent neutrality zone also aligns with an important psychological level. It could act as a key barrier in case of short-term bearish corrections.
- 159.411 – Main support: This level coincides with the 50-period simple moving average. A strong break under this area could put the bullish trendline at risk and open the door to a more relevant selling bias over the coming weeks.
Written by Julian Pineda, CFA, CMT – Market Analyst
Follow him on: @julianpineda25