Hawkish BOJ signals are shifting sentiment, putting pressure on USDJPY while supporting safe havens, as markets begin to reassess carry trade exposure.
Energy-Driven Inflation and Carry Trade Risks
This tension between central bank outlooks and carry trade risks is being driven primarily by the sharp rise in crude oil prices, which have held steadily above the $100 mark for a second month, as highlighted in my recent video Oil Markets Enter New Era?
Ongoing disruptions in the Middle East, with rising risks of renewed escalation between the US and Iran, are reinforcing a persistent inflation outlook, not one that spikes and fades, but one that may linger. This is pushing central banks toward a more hawkish stance.
As a result:
- Gold declined toward the 4,520 level following the FOMC’s hawkish tone, before rebounding by over 100 points on renewed BOJ intervention signals above 4,600
- USDJPY surged toward 160.80 following dollar strength post-FOMC, before dropping over 250 points on intervention concerns from Japanese officials
This remains a headline-driven market, with key levels in focus to confirm whether these moves evolve into longer-term structural shifts.
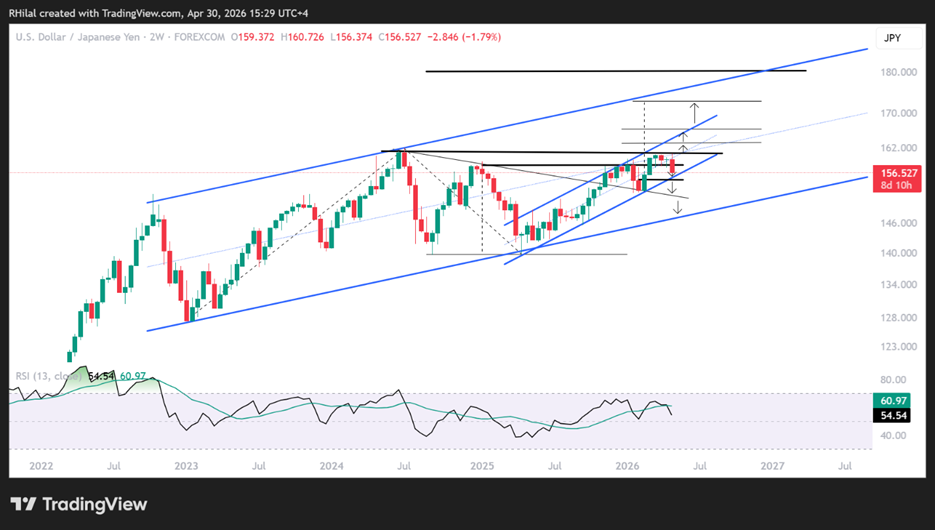
USDJPY Price Outlook: 2 Week Time Frame – Log Scale
Source: Trading view
Latest video analyzing the USDJPY pair: USD/JPY Holds 160, But for How Long?
From a 2-Week perspective, USDJPY remains in a bullish primary trend, with price action trading within a parallel uptrend since late 2022, above the long-term trendline connecting highs between 1990 and 2022.
Price is currently pulling back from the 160.80 resistance level, which dates back to the 1990 highs and aligns with the 1.272 Fibonacci extension of the long-term trend spanning the 2011 lows, 2015 highs, and 2016 correction.
A confirmed break above 160.80—and then 164—could open the path toward 180, aligning with the 1978 lows and the upper bound of the 2022–2026 channel. This scenario would likely be supported by a more hawkish Fed outcome, and less hawkish BOJ outcome.
On the downside, following the BOJ's hawkish tilt, price is testing the trendline connecting higher lows since April 2025, a one-year support near 154.80. As it also faces resistance near the midpoint of the 2022-2026 channel, a break below 154.80 would increase short-term downside risks toward yearly lows near 152. A breakdown further below 152 would extend selling forecasts to the bottom of the 2022-2026 channel near 147.
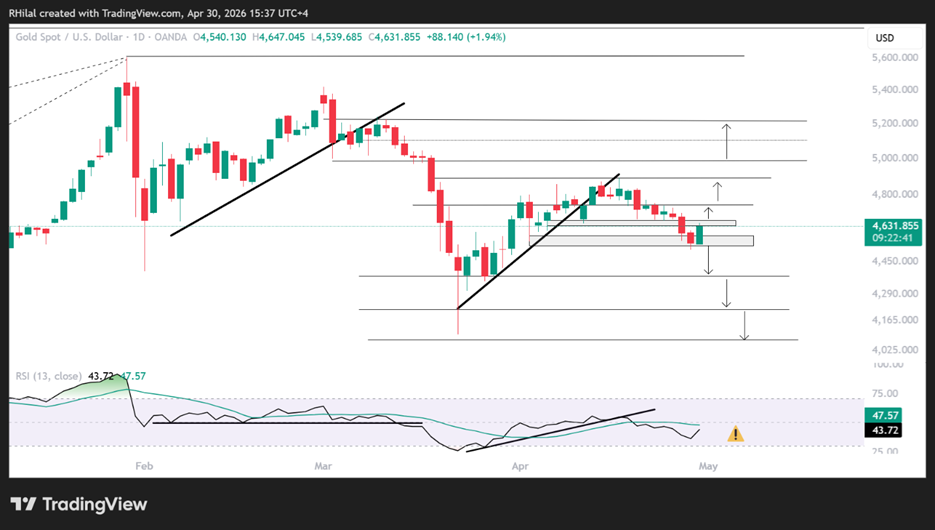
Gold Price Outlook: Daily Time Frame – Log Scale
Source: Trading view
On the daily chart, gold is consolidating below the trendline connecting higher lows since March 2026 (originating near the 4,080 level), and below the 4,880 resistance. This structure has held since mid-April, mentioned in my previous articles: Gold, Silver Price Outlook: Caution Builds Below $4880 and $84 reflecting a setup similar to the March drawdown, with momentum holding below neutral and key support levels coming into focus.
Bullish scenario
A close above 4,660 and 4,740 would open the path toward 4,980, where initial pullback risks may emerge. These levels align with the 0.618 and 0.786 Fibonacci retracement levels of the April 2026 decline.
A sustained move above 4,980 would reinforce the longer-term outlook toward 5,250, a key barrier before a potential extension toward the 5,600–6,000 range or a new consolidation phase.
Bearish scenario (higher probability as of April 28, 2026)
A close below the 4,520 support would extend short-term downside risks toward key levels aligning with Fibonacci retracement ratios:
- 4,380 (38.2%)
- 4,220 (50%)
- 4,070 (61.8%)
The 4,070 level is particularly critical, both technically and structurally, as it may either trigger a reversal or open the door to a deeper drawdown toward 3,840, 3,560, and 3,200, aligning with the 78.6%, 100%, and 127% extensions.
This scenario would likely coincide with a move in silver toward the $48 area.
Written by Razan Hilal, CMT
Follow on X: @Rh_waves