Key Events
- Weekly shadows across dollar pairs highlight bullish pressure and rising mean-reversion risks for February
- Dollar pairs are trading back above key levels, with DXY above 97, USDJPY above 155, and USDCAD reclaiming key support
- US ISM Manufacturing PMI rose to three-year highs at 52.6, adding bullish support to dollar pairs
- Partial US government shutdown risks may delay upcoming economic reports
The steep momentum observed across charts throughout January may be entering a reversal phase, at least for dollar pairs and major currencies. Meanwhile, momentum in precious metals remains intact amid structural shifts under the Trump administration and renewed uncertainty tied to the partial government shutdown, following the failure to pass a funding bill for Homeland Security and ICE. Recent fatal events have kept markets on edge.
As for the US economy and the dollar, strong corporate earnings lifted risk appetite, pushing indices back toward their early-2026 highs. However, key technical levels remain critical to confirm the sustainability of this move, especially amid persistent geopolitical tensions and renewed concerns around AI-related capital expenditure relative to earnings outcomes.
Dollar Outlook
The recent dollar drawdown appears to have been largely priced in near the 96 level — a long-term trend support extending from 2008. This level coincides with renewed hawkish election-related Federal Reserve rhetoric and a surge in US ISM Manufacturing PMI to 52.2, firmly within expansionary territory. As a leading economic growth indicator, the ISM rebound has reinforced bullish pressure off the January 2026 lows.
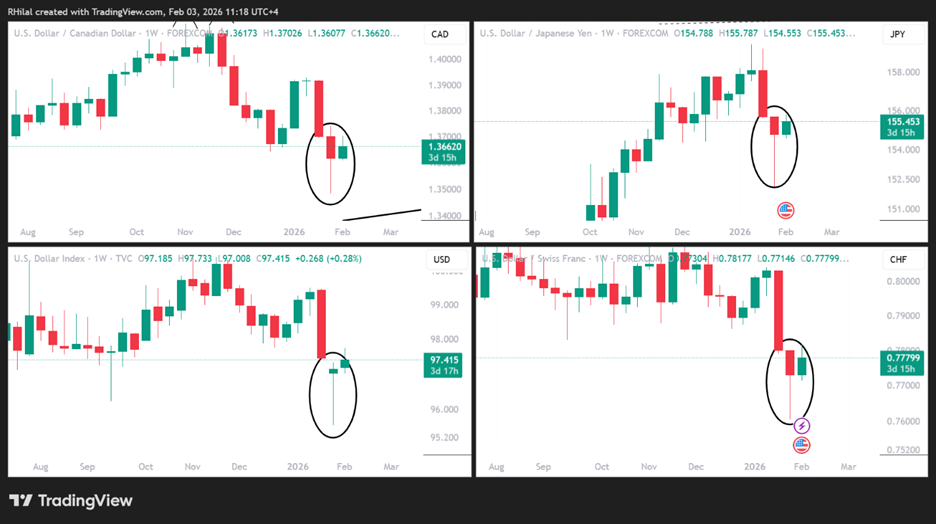
However, upcoming economic data releases remain uncertain due to the partial government shutdown, placing the sustainability of the dollar rebound under scrutiny. Notably, dollar pairs printed sharp weekly shadows off the January lows — a technical signal that continues to elevate mean-reversion risks into February.
Weekly Time Frame – USDJPY, USDCAD, DXY, and USDCHF
Source: Trading view
From a technical perspective, extended lower shadows reflect rejected downside levels — in other words, bullish dominance over bearish pressure. The weekly timeframe adds further weight to this signal, especially when aligned with the recent surge in ISM Manufacturing PMI. That said, volatility risks remain elevated amid geopolitical developments and upcoming economic data uncertainties.
Technical Analysis: Quantifying Uncertainties
For DXY, my framework maintains:
A bearish bias following a confirmed weekly close below the 96 level
A bullish bias only if price holds cleanly above 98, 99.50, and the key 100.40 level
Against this backdrop, the following scenarios emerge for USDJPY and USDCAD.
USDJPY Outlook: Weekly Time Frame – Log Scale
Source: Trading view
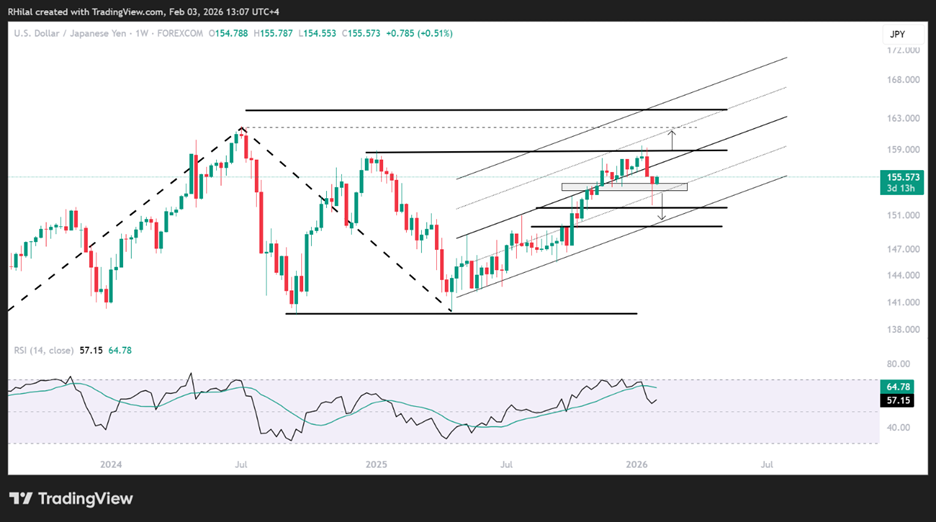
Following January’s sharp downside wick toward the 152 support zone, USDJPY has rebounded into bullish-bias territory above 154.80 (rounded to 155). Upside resistance levels are located at 158.80, 161, and 164.
These elevated levels warrant caution, given historical intervention risks that previously triggered sharp drawdowns near the 160 area. The broader uptrend from the April 2025 lows remains intact, with key downside levels at 154, 151.80, and 149.80 — aligning with the lower bound of the trend unless a clear structural breakdown materializes.
USDCAD Outlook: Weekly Time Frame- Log Scale
Source: Trading view
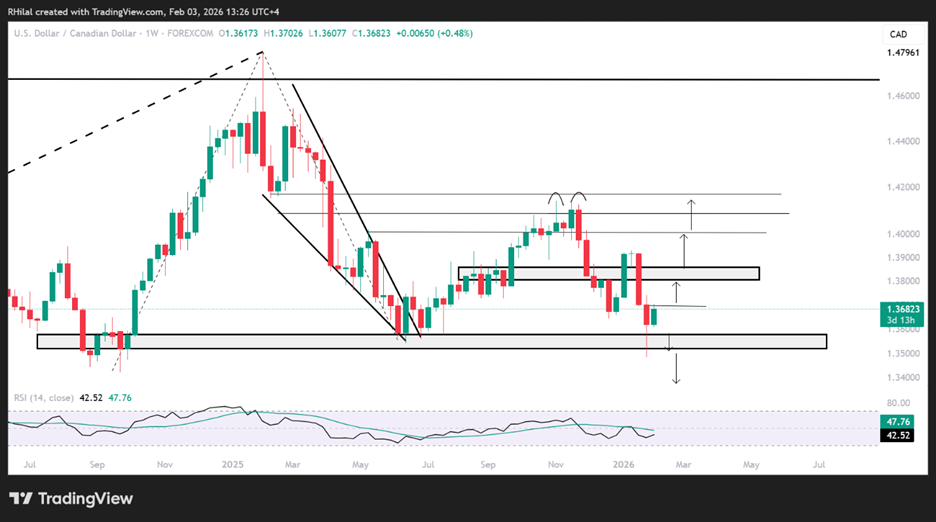
USDCAD briefly dropped toward levels last seen in 2024 near 1.3480 before recovering above the 1.36 mark. Applying Fibonacci extensions from the September 2024 low, February 2025 high, and January 2026 low, key upside levels emerge at 1.3860, 1.40, and 1.4150 — zones that would help confirm the sustainability of the rebound before another potential acceleration higher.
On the downside, the 1.3580–1.3420 support zone remains critical. A failure to hold this area could expose the pair to a deeper structural breakdown toward the 1.33 and 1.30 levels.
Overall, bullish and bearish scenarios for USDJPY and USDCAD are expected to move in tandem with DXY, as the index continues to test its long-term 2008–2026 trend support.
Written by Razan Hilal, CMT
Follow on X: @Rh_waves