
During the last trading session of the week, the USD/MXN pair came under selling pressure, posting a 0.84% decline in favor of the Mexican peso shortly after the remarks from Federal Reserve Chair Jerome Powell. At present, selling pressure remains a key factor, as Powell’s comments at Jackson Hole suggested that U.S. interest rates could move lower, which once again weakened the U.S. dollar. As long as these expectations of rate cuts persist, downward pressure is likely to continue dominating in the short term.

What Happened at Jackson Hole?
In his official speech, Jerome Powell emphasized that inflation remains a major challenge for the central bank, as the 2% target has not yet been reached. However, he also pointed out that both economic activity and the labor market are showing signs of cooling, which requires immediate attention.
Within this context, Powell’s comments suggest that a rate cut could be on the table at the Fed’s next decision. He stressed that a weakening economy could place downward pressure on inflation, which has shifted the focus more toward economic activity and employment in the short term. This has raised expectations of a more flexible monetary stance in the near future.
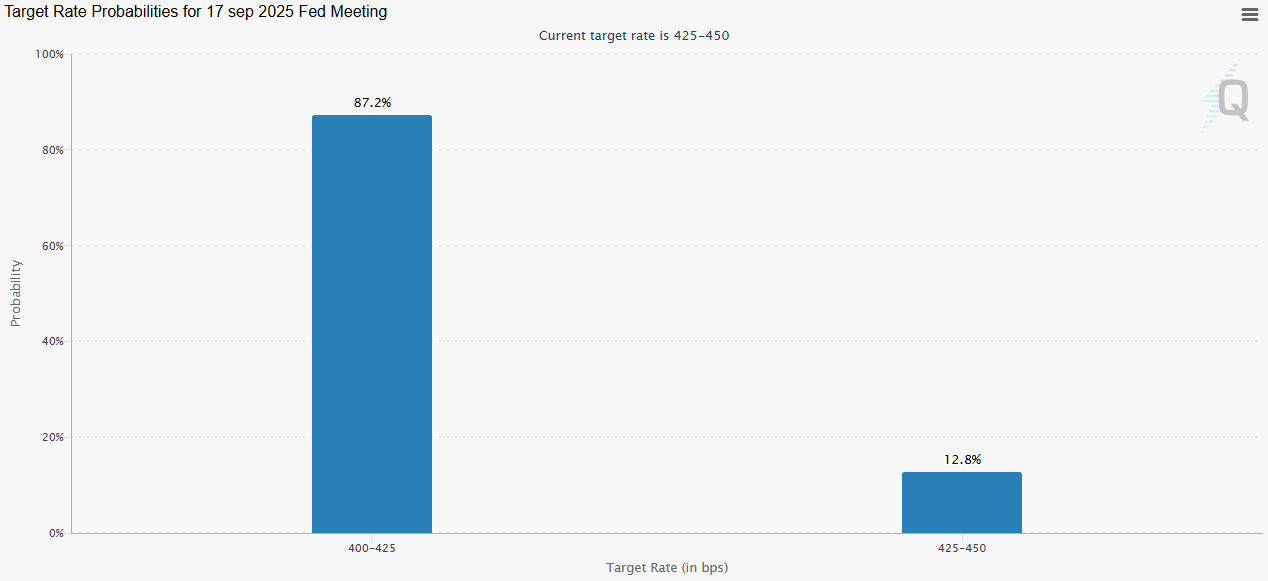
In fact, the probabilities of a cut at the September 17 meeting have risen sharply. According to CME’s FedWatch Tool, there is currently an 87.2% probability that the Fed will lower rates to 4.25%, down from the current 4.5%.
Source: CMEGROUP
This new outlook of a more dovish Fed has weakened the dollar during the latest session, as lower rates reduce the attractiveness of U.S. investments and diminish demand for the currency. As a result, selling pressure on the USD/MXN could intensify in the days ahead.
What Role Does Banxico Play?
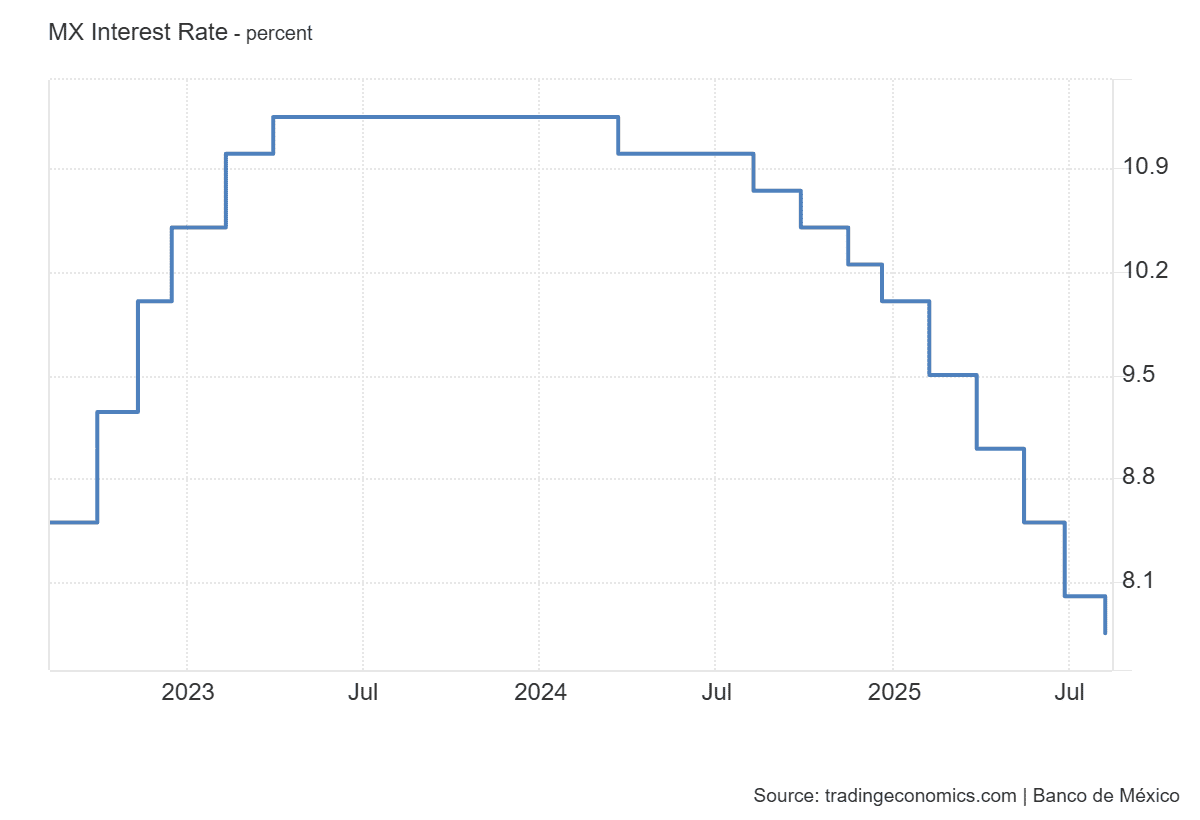
The Bank of Mexico currently maintains its benchmark rate at 7.75%, significantly higher than the U.S. rate of 4.5%. However, there is concern about the bank’s flexible stance in recent meetings, as consecutive rate cuts have already been applied.
Source: TradingEconomics
It is also worth noting that inflation in Mexico has performed favorably. July’s data came in at 3.51%, well within the central bank’s target range of 2% to 4%, indicating that inflation control has been effective in the short term.

Source: TradingEconomics
With inflation under control, the need for high interest rates diminishes, opening the door for further cuts to stimulate the economy in the remainder of the year. However, the key question is whether Banxico will move more aggressively than the Federal Reserve. If Mexico’s central bank accelerates its easing and narrows the rate gap with the U.S., the peso could lose its advantage, which would likely reignite buying pressure on the USD/MXN. Banxico’s next rate decision is scheduled for Thursday, September 25.
USD/MXN Technical Outlook
Source: StoneX, Tradingview
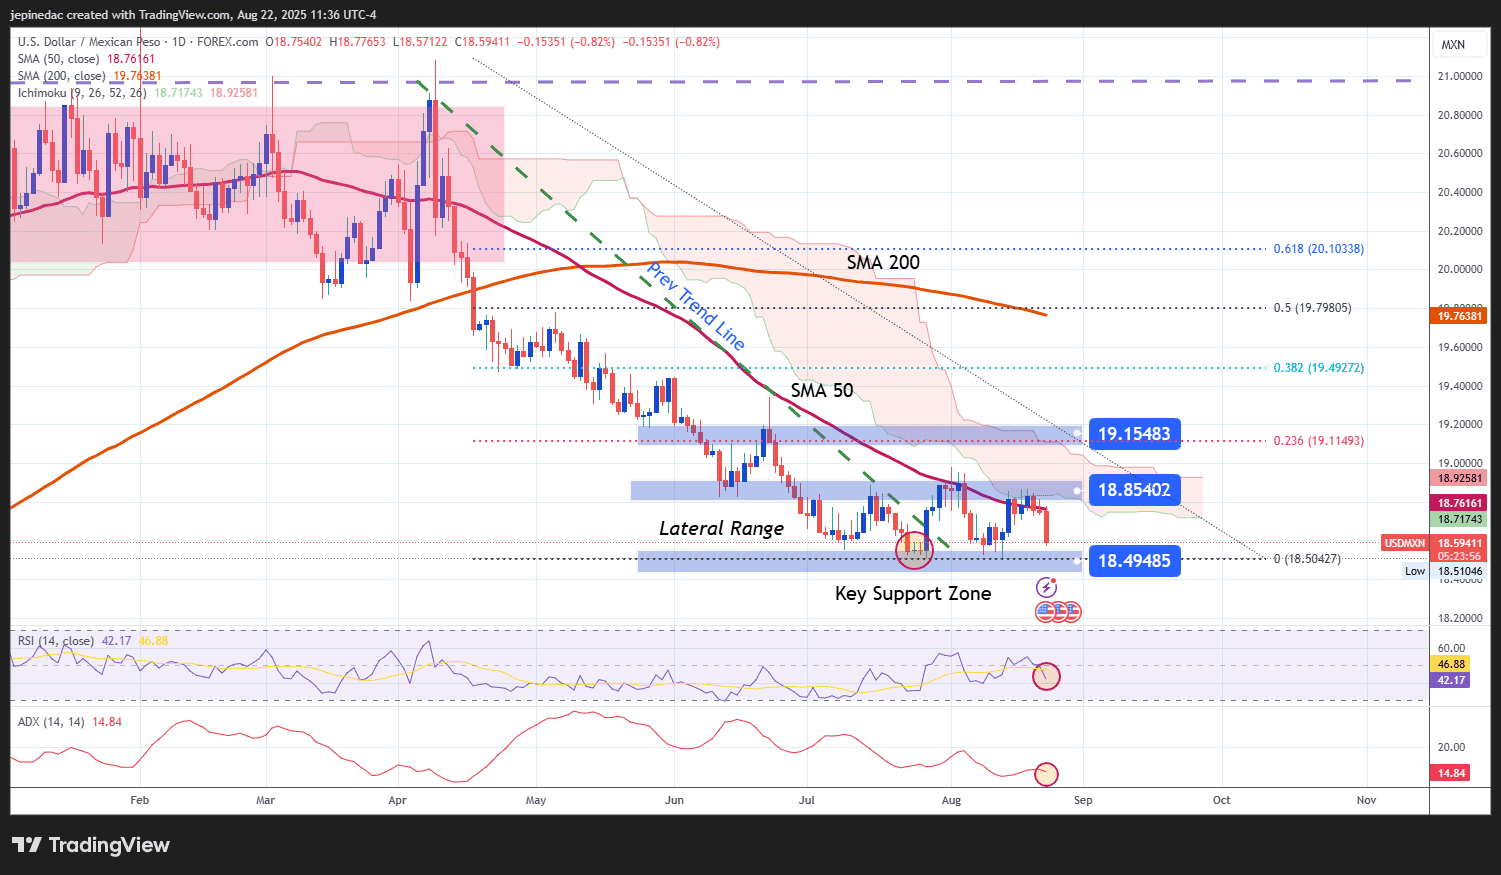
- Short-Term Range Holds: Recent oscillations in USD/MXN have defined a sideways range, with resistance capped at 18.85 and support near 18.49. For now, bearish bias has resurfaced, putting this structure under pressure. However, the lower boundary is still holding, limiting further downside. A break below this level, though, could pave the way for a new bearish structure in the short term.
- RSI: the RSI line continues on a negative slope, moving below the neutral 50 level. This shows that selling momentum has become dominant in the short term, and if the indicator continues to fall, bearish pressure could intensify, though there is still room before reaching oversold conditions.
- ADX: the ADX remains below 20, reflecting that trend strength is still limited. Unless this level is surpassed, the market may continue to show low volatility and lean toward a more neutral scenario, despite the prevailing bearish pressure.
Key Levels:
- 18.50 – Key Support: a psychological level aligned with recent lows. A break below could reactivate bearish momentum and extend the downward trend observed in prior weeks.
- 18.85 – Near-Term Barrier: corresponds to the top of the lateral range and coincides with the 50-period moving average. This zone is the most important resistance to block consistent bullish corrections in the short term.
- 19.16 – Final Resistance: aligned with the 23.6% Fibonacci retracement, this level is the key reference for validating a shift toward a more bullish scenario in the short term.
Written by Julian Pineda, CFA – Market Analyst
Follow him at: @julianpineda25