
The latest Commitment of Traders (COT) report reveals a sharp reduction in VIX futures shorts among large speculators and asset managers, suggesting traders are becoming less comfortable betting against volatility.
Meanwhile, short bets against S&P 500 futures have increased as the index struggles to regain bullish momentum. Positioning across gold, silver, crude oil and the US dollar also reveals some interesting extremes.
But does the dramatic unwinding of VIX shorts signal growing fears of a stock market sell-off, or are traders simply reducing their exposure to volatility?
VIX Futures Positioning Signals a Shift in Stock Market Sentiment
COT Snapshot: VIX Short Covering Surges as Silver and Oil Lag
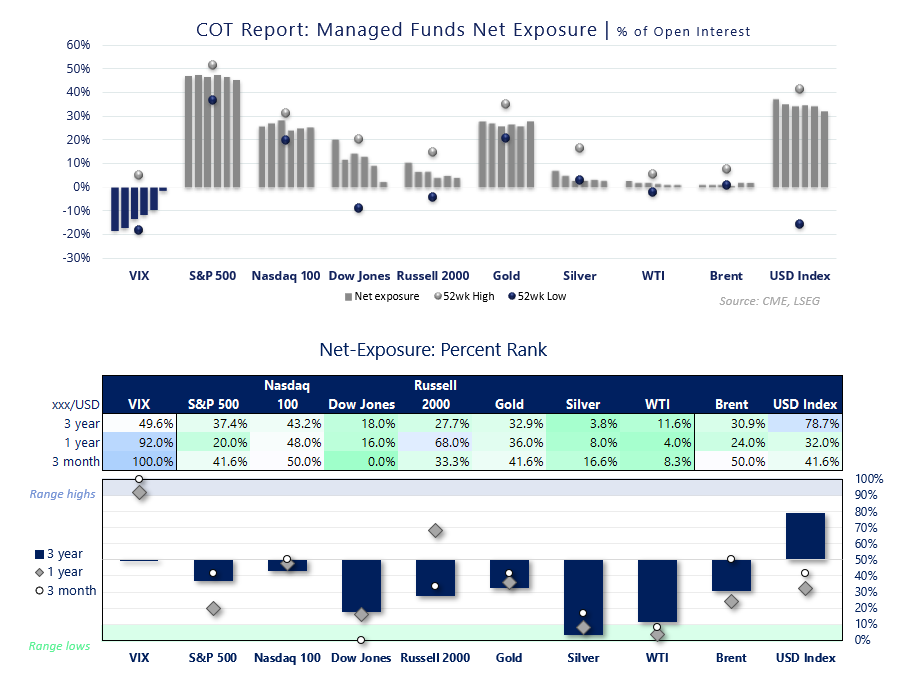
- VIX: Aggressive short covering lifted the three-month percent rank to 100% and the one-year rank to 92%. However, net positioning remains bearish, suggesting reduced appetite to short volatility rather than aggressive bullish positioning.
- S&P 500: Asset managers remain heavily net long, despite adding 18.5k gross shorts. The one-year percent rank of just 20% suggests positioning has weakened substantially relative to earlier levels.
- Dow Jones and Russell 2000: Dow positioning looks particularly weak, with its three-month percent rank at 0% and three-year rank at just 18%. Russell 2000 positioning is relatively stronger over the past year, at 68%, compared with 20% for the S&P 500.
- Gold and silver: Bullish exposure remains historically subdued. Gold's three-year rank is just 32.9%, while silver stands at a particularly depressed 3.8%, and 8% over one year. Silver looks considerably more vulnerable to a short-covering rebound if sentiment improves.
- WTI crude oil: Managed money positioning remains deeply depressed, with a one-year rank of just 4% and three-year rank of 11.6%. Brent positioning is relatively stronger, with a one-year rank of 24%.
- US Dollar Index: Net-long exposure remains elevated relative to its three-year history (78.7% rank), although its one-year rank of 32% suggests bullish positioning has cooled from more recent extremes.
VIX Futures: Speculators Slash Short Exposure
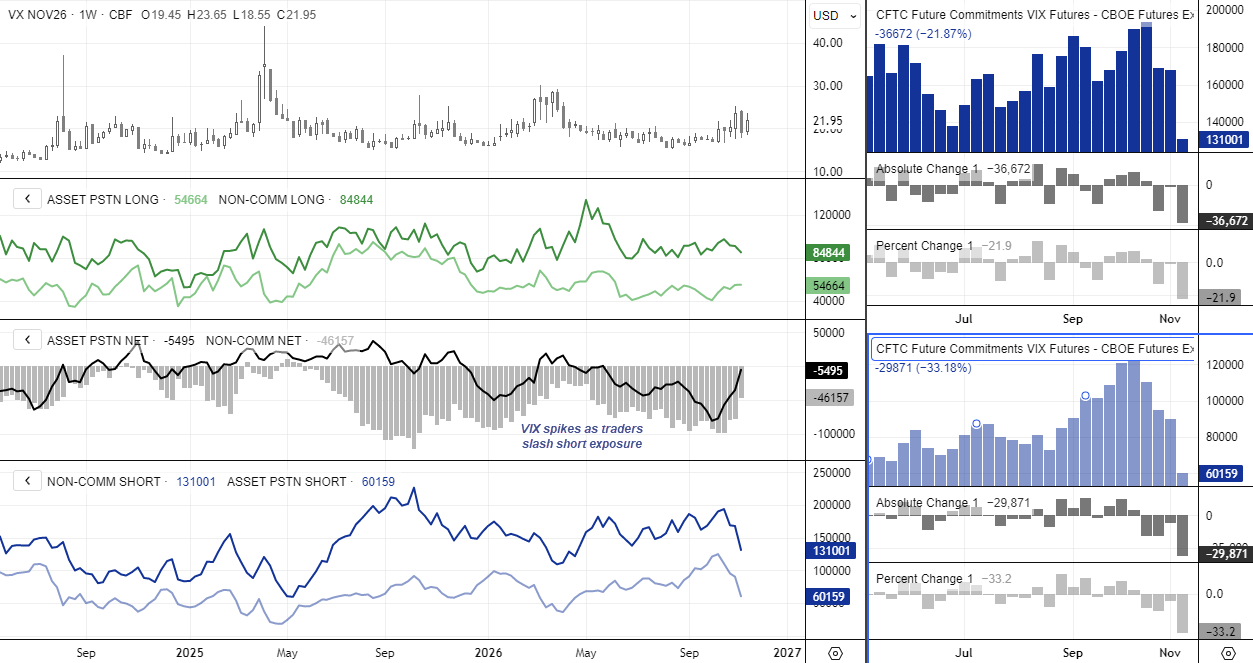
Large speculators reduced gross VIX futures shorts by 36,672 contracts in the week to 10 November, bringing their net-short exposure down by 30,759 contracts to 46,157. Which marks a 40% reduction in net shorts from the prior week - the largest weekly change since December 2024.
Asset managers were also aggressive in reducing their bearish exposure, cutting gross shorts by 29,871 contracts (33.2%), to 60,159, reducing net-short exposure to a mere 5,495 contracts.
It is worth noting that large speculators also reduced gross longs by 5,913 contracts, while asset managers' gross longs were virtually unchanged.
This raises the possibility that traders are simply reducing their exposure to VIX futures, rather than aggressively positioning for a sustained rise in volatility. After all, stronger conviction that volatility will rise would theoretically attract fresh buying.
Either way, the appetite to remain short volatility has clearly weakened, potentially leaving the market more sensitive to further bouts of equity-market volatility.
Source: CME, LSEG
S&P 500 Shorts Rise as Bears Target June Low
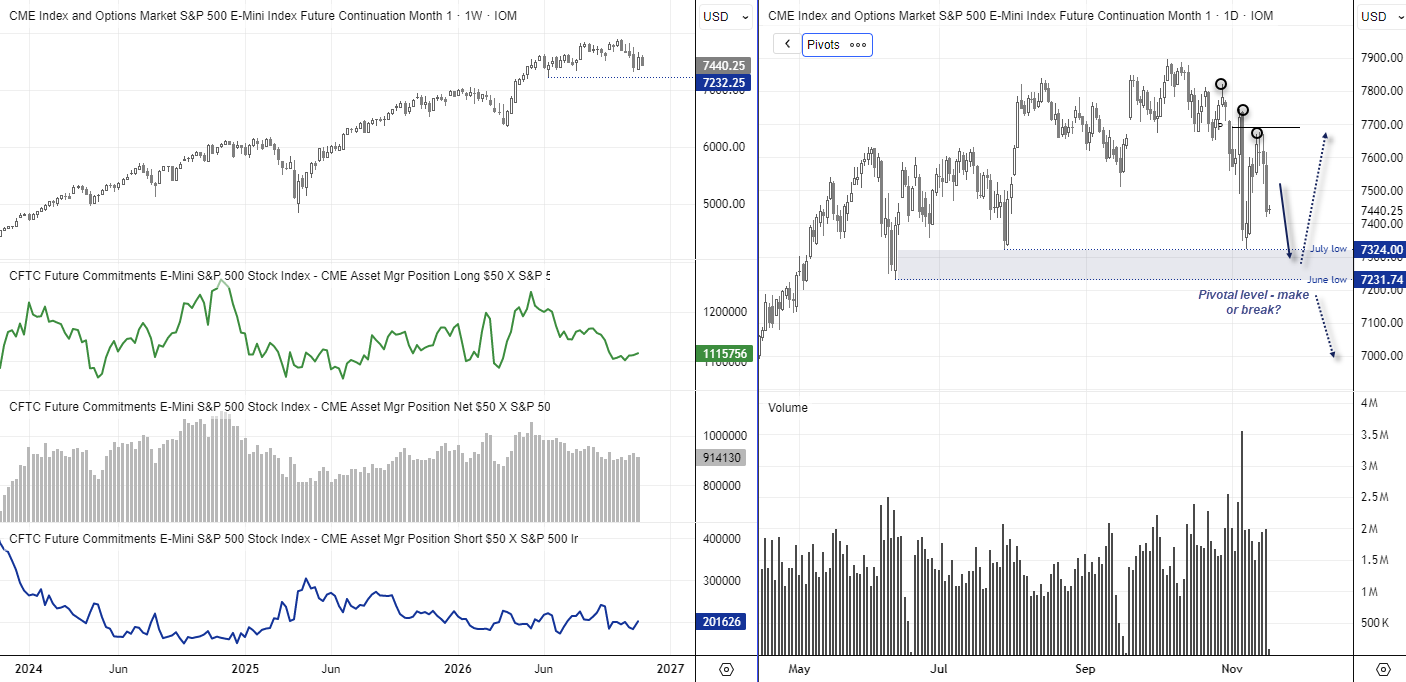
Asset managers increased their gross shorts against S&P 500 futures by 18.5k contracts (10.1%), although some of these positions may have been shaken out by the market's 2.5% rally into Friday's close. However, momentum has clearly turned lower this week, continuing the decline from the record high. Note that a lower high has also formed beneath the monthly pivot point, adding weight to this week's decline.
The question now is whether bears can break prices beneath the July and June lows. They have around four to five weeks before we reach the period in December when Santa's rally tends to kick in, assuming one materialises this year. And bears likely need to break the S&P 500 beneath the June low of 7231.74 to really assert their dominance.
Until then, we'll continue to monitor sentiment towards VIX futures, as a sustained S&P 500 sell-off would arguably have a greater chance of success if we finally see a strong increase in bullish bets on volatility.
Source: CME, LSEG