
As the third week of November concludes, the cryptocurrency market continues to show significant weakness across most major assets. Assets like BTC have posted declines of more than 30% from their all-time highs, reinforcing a persistent bearish bias that continues to dominate market sentiment. Selling pressure appears to have no end in sight, as the market remains in a phase where confidence struggles to recover, suggesting that this downtrend may persist as the year draws to a close. Most cryptocurrencies continue to display negative movements, with no clear signs of recovery toward the end of the week.

Performance of Major Cryptocurrencies
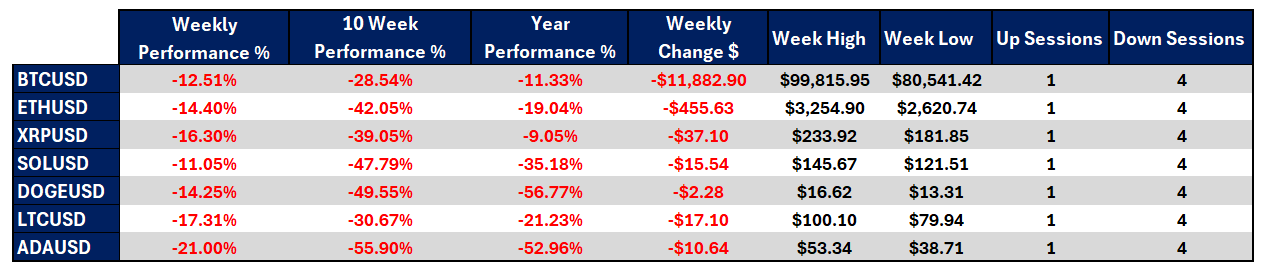
Source: Data - StoneX, Tradingview
- Cardano (ADA) remains the most depreciated cryptocurrency of the week, falling -21.00%, making it one of the weakest assets in recent sessions. In contrast, Solana (SOL) has also declined, but to a lesser extent (-11.05%), likely because it had already lost considerable ground in previous weeks.
- Over the last 10 weeks, all major cryptocurrencies have maintained a dominant bearish trend, reflecting a persistent structural weakness that continues to define the market. Cardano (ADA) remains the most affected, both in the short and medium term, accumulating a loss of -55.90%, while Bitcoin (BTC) has shown greater resilience, with a decline of -28.54%, indicating that the leading cryptocurrency has managed to soften the most aggressive declines compared to the rest of the market.
- On a year-to-date basis, for the first time, all major cryptocurrencies are trading below their yearly opening levels. Ripple (XRP) is the least depreciated, down -9.05%, while Dogecoin (DOGE) remains the worst performer, with a loss of -56.77%, representing more than half of its value erased since the start of the year. This consolidates it as one of the least attractive assets among leading cryptocurrencies.
- Bitcoin continues to post lower lows, trading below $100,000 per BTC, reinforcing the dominant selling pressure that could persist in the short term. During the week, BTC even dropped to the $80,000 zone, levels not seen since the first half of 2025, moving further away from its historical highs.
- Overall, the market faces steady downward pressure, with Bitcoin and other major cryptocurrencies accumulating four or more consecutive losing sessions, confirming the bearish bias as the prevailing trend in the short term.
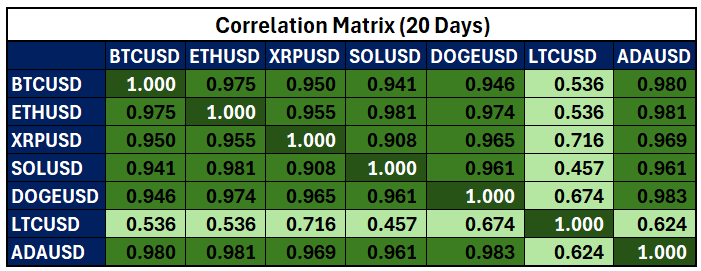
Colors range from red to green – red indicates negative correlations, and green indicates positive correlations.
Source: Data - StoneX, Tradingview
Since the beginning of the current bearish cycle, most major cryptocurrencies have maintained a strong positive correlation with Bitcoin, with coefficients above 0.8 on average over the past 20 sessions. This demonstrates close interdependence among short-term market movements. However, Litecoin (LTC) has partially decoupled from Bitcoin’s pattern, with a correlation of just 0.536, suggesting it has experienced occasional bullish corrections but remains predominantly bearish, in line with broader market trends.
Given this backdrop, overall selling sentiment continues to dominate. As Bitcoin remains under persistent distrust, the rest of the market tends to mirror its behavior, reinforcing a structural weakness across cryptocurrencies. Unless the leading crypto manages to restore investor confidence, other assets are likely to continue declining, further undermining the sector’s credibility in the coming weeks.
It is worth noting that these correlation coefficients may fluctuate over time as new market data becomes available.
Bitcoin Shows a Sharper Downtrend
Source: StoneX, Tradingview
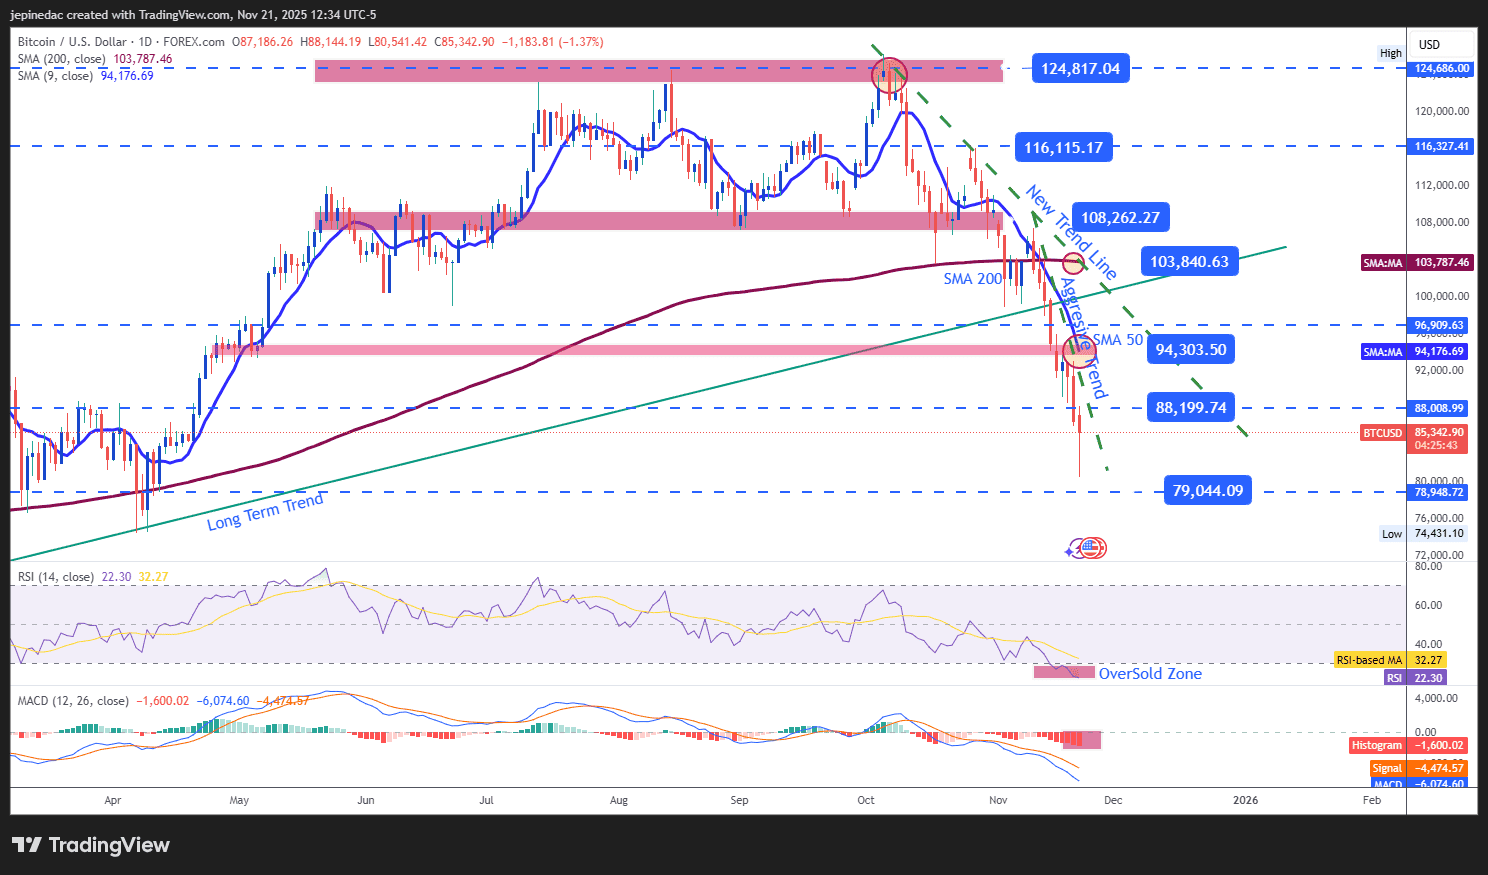
By the end of the week, Bitcoin maintains a notable bearish structure, consolidating an aggressive selling bias that has even broken the $90,000 support level. Currently, the downtrend line that began from the October all-time highs has accelerated, extending toward the $79,000 area—the 2025 lows. There are no clear bullish signals suggesting a reversal, leaving the overall outlook firmly under bearish control.
However, the speed of the recent drop could create a technical imbalance, potentially opening the door to short-term corrective rebounds in the coming sessions.
Indicators:
- Both the RSI and MACD remain below their neutral levels (50 and 0, respectively), reflecting a consistent selling momentum in short-term moving averages and the past 14 trading sessions. However, the RSI line has started to hover near the 20 level, below the oversold threshold of 30, which could signal a potential technical rebound in the short term due to recent excessive selling pressure.
Key Levels:
- $94,000 – Major Resistance: Represents the most important resistance level on Bitcoin’s chart, coinciding with a recent retracement area and the 50-period moving average. A sustained move above this level could reduce the intensity of the current downtrend, potentially signaling a neutral phase in price action.
- $88,199 – Nearby Barrier: A recent retracement zone that may act as a temporary resistance during short-term corrective rallies.
- $79,000 – Critical Support: Marks the yearly lows and serves as the most relevant downside barrier. A break below this level could trigger a more aggressive selling phase, establishing a stronger downtrend in the short term.
Litecoin Approaches Levels Not Seen Since June
Source: StoneX, Tradingview
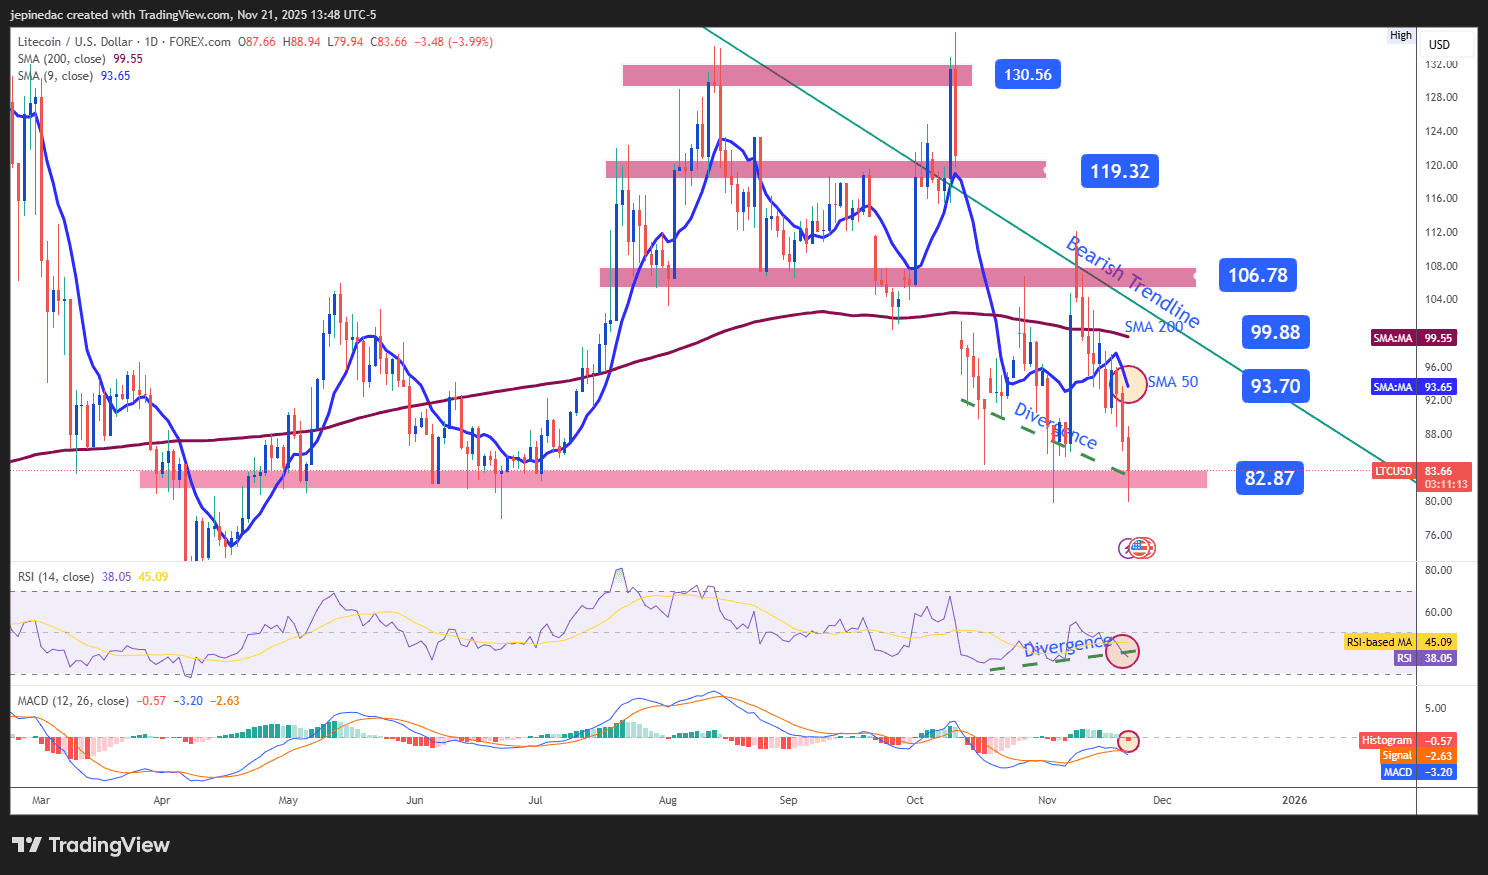
Litecoin (LTC) maintains a steady bearish bias, following the broader market trend. The price has now reached a key support area, with values not seen since June of this year. If selling pressure persists below this level, a more aggressive downtrend could form. However, the proximity to these recent lows may also allow for short-term technical corrections.
Indicators:
- Both the MACD and RSI remain below their neutral levels (0 and 50, respectively), confirming the prevailing bearish momentum. However, recent RSI movements have shown higher lows, while Litecoin’s price continues to mark lower lows, forming a bullish divergence that could signal a short-term technical rebound as the imbalance between buying and selling forces becomes more pronounced.
Key Levels:
- $99.88 – Major Resistance: Corresponds to the 200-period moving average, where the dominant downtrend line currently converges. If the price reaches and breaks this level, it could revive the bullish bias and challenge the current bearish structure.
- $93.70 – Nearby Resistance: Marks the 50-period moving average, which may act as a temporary resistance for short-term corrective rallies.
- $82.87 – Key Support: Represents the lowest levels since June and acts as the most important support zone. A break below this level could intensify selling pressure, favoring the formation of a more aggressive bearish trend.
Written by Julian Pineda, CFA, CMT – Market Analyst
Follow him on: @julianpineda25