



ASX 200 Market Outlook: All Sectors See Red After Hawkish RBA Hold
ASX 200 fell across all sectors after a hawkish RBA hold lifted rate expectations and pushed yields higher.
Share this:
The Reserve Bank of Australia kept the cash rate at 3.6% as expected but delivered a distinctly hawkish tone. Policymakers warned that inflation risks have “tilted to the upside”, with Governor Bullock signalling the board remains dissatisfied with current price pressures. February’s meeting now hinges on the trajectory of inflation, placing extra weight on the January 26 quarterly CPI release.
Bond markets reacted swiftly: Australia’s 3-year yield climbed to 4.15%, while the 1-year sits at 3.97%. Bloomberg data shows a 25bp hike now fully priced by June, compared with November before the meeting. AUD/USD gained 0.4%, although further upside may be limited given a hawkish outcome has been priced for weeks.
The ASX 200 fell 0.45% in its worst session in six days, with all 11 sectors trading lower following the RBA’s stance.
View related analysis:
View related analysis:
ASX 200 Slides as Hawkish RBA Weighs on All Sectors
ASX 200 Market Snapshot
- A 3-bar evening star reversal formed on the ASX 200 daily cash chart.
- Information Technology (XIJ), Health Care (XHJ) and Energy (XEJ) led all 11 sectors lower.
- Materials (XMJ) pulled back from its record high for a second straight session.
- Market breadth weakened: 66 stocks advanced, 123 declined and 11 finished unchanged.

Chart analysis by Matt Simpson - source: ASX, LSEG


ASX 200 Futures (SPI 200) Sector Analysis
The daily chart shows bearish momentum returning around the 200-day EMA and monthly pivot. Daily volumes remain below the 20-day average, although they are slightly higher than yesterday’s. While price holds beneath last week’s high, the bias still favours a move towards 8500.
Take note that the FOMC meeting could influence the ASX 200 via Wall Street’s reaction. I suspect the Fed will lean slightly hawkish, which may lift the US dollar and weigh on US indices. That said, the ASX also has a tendency to firm into the new year from around mid-December.
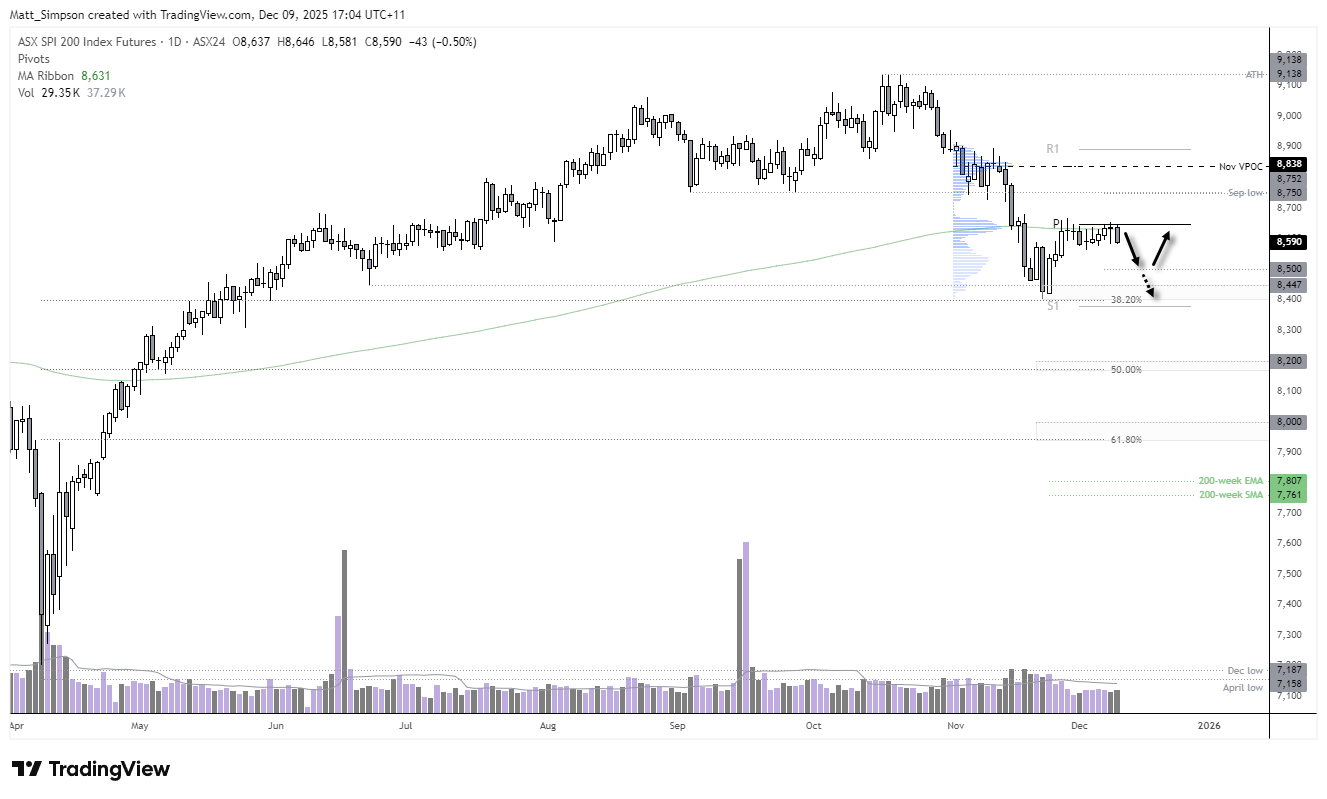
Chart analysis by Matt Simpson - Source: TradingView, ASX SPI 200 Index Futures
Related tags:
Latest market news




The complete CFD trading experience
Award-winning platforms, competitive spreads, low commissions and dedicated support.
We live and breathe the markets and are dedicated to helping traders realise their ambitions as we continue to set the industry bar.
Economic calendar
Web Trader platform
Our sophisticated web-based platform is packed with features.
Related articles
Magnificent Seven Earnings Preview: Is the AI Boom Facing Its Biggest Test Yet?
After a wobble in the broader AI trade, the Magnificent Seven" stocks are reporting earnings in the coming week - see the key themes and Nasdaq 100 levels to watch!

Nasdaq 100 forecast: Tech stocks not out of woods yet
US index futures pushed higher in the first half of Friday’s session, taking cues from a strong performance from European equities. Both European and US equity futures extending yesterday’s impressive recovery after the sharp sell-off earlier in the week. But the lingering concerns around the AI investment cycle remain, while bond markets were easing lower again, lifting yields.


ASX 200 Outlook: A Rates Trade Disguised as a Stock Market?
Australian bond futures have exhibited a far stronger relationship with the ASX 200 than Wall Street over recent months. Now both markets are displaying remarkably similar price structures.

StoneX Europe Ltd may make third party material available on this website which may contain information included but not limited to the conditions of financial markets. The material is for information purposes only and does not contain, and should not be construed as containing, investment advice and/or investment recommendation and/or an investment research and/or an offer of or solicitation for any transactions in financial instruments; any decision to enter into a specific transaction shall be made by the client following an assessment by him/her of their situation.
StoneX Europe Ltd makes no representation or warranty and assumes no liability as to the accuracy or completeness of the information provided, nor any loss arising from any investment based on a recommendation, forecast or other information supplied. You should always seek independent advice as to your suitability to speculate in any related markets and your ability to assume the associated risks, if you are at all unsure. We are not under any obligation to update any such material. Any opinion made may be personal to the author and may not reflect the opinion of StoneX Europe Ltd.