



ASX200: RBA meeting minutes pass - Next data point, AU jobs data
The RBA’s February 1st board meeting minutes were released this morning. As expected, they offered little in the way of new information following recent RBA communique, including Governor Lowe’s National Press Club address and last Friday’s Statement of Monetary Policy.
Share this:

The minutes showed that while the RBA was pleased the economy was making progress towards its economic goals, the central bank would remain patient.
“While inflation had picked up, members agreed it was too early to conclude that it was sustainably within the target band.”
Within the final paragraph, the RBA noted that “Wages growth also remained modest, and it was likely to be some time before aggregate wages growth would be at a rate consistent with inflation being sustainably at target.”
Attention now turns to Thursday's jobs data for January, expected to see a 15K fall in employment as economic activity softened following the Omicron outbreak. The unemployment rate is expected to fall to a new cycle low of 4.1%, cushioned by a decline in the participation rate.
Reflecting the low unemployment rate, stronger growth, and inflation numbers in 2022, there are five 25bp interest rate hikes priced into the Australian rates market before the end of the year. The first-rate hike is priced to come in June after the Federal Election in May.
On top of the pricing of rate hikes, the Australian equity market is digesting, amongst other things 1H 2022 earnings reports, surging energy prices, and a possible invasion of Ukraine by Russia.
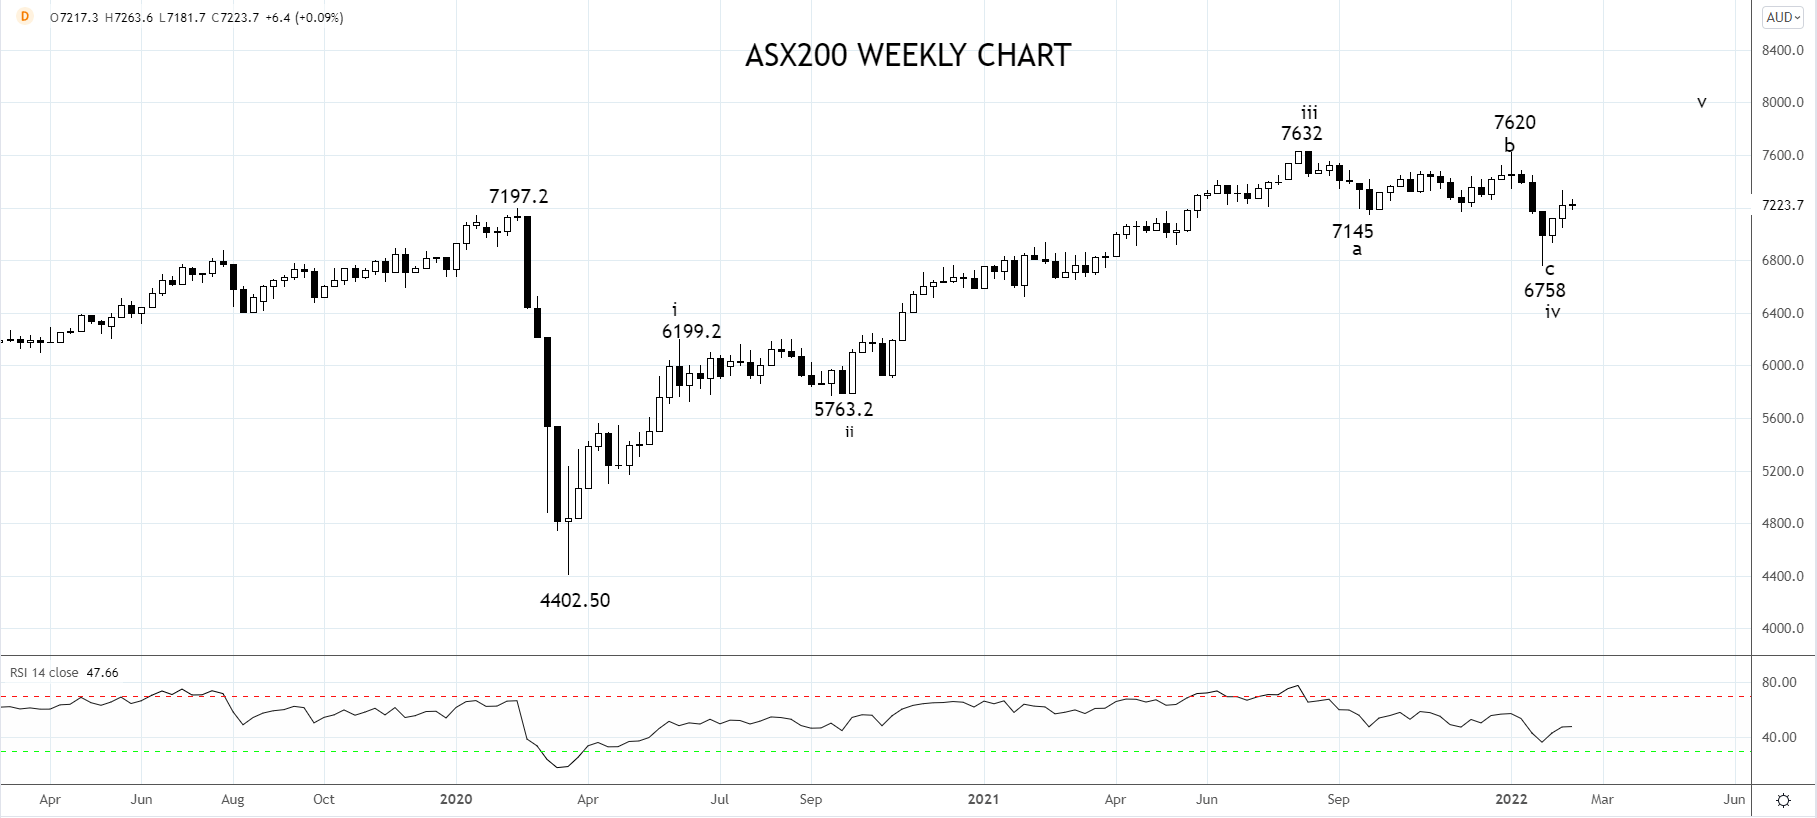
This probably explains why the technical picture in the ASX200 is also a little convoluted. On the Weekly chart below, it appears the ASX200 completed a three-wave correction from the August 7632 high at the 6758 low. The recent rally above 7200 suggests the uptrend has resumed.
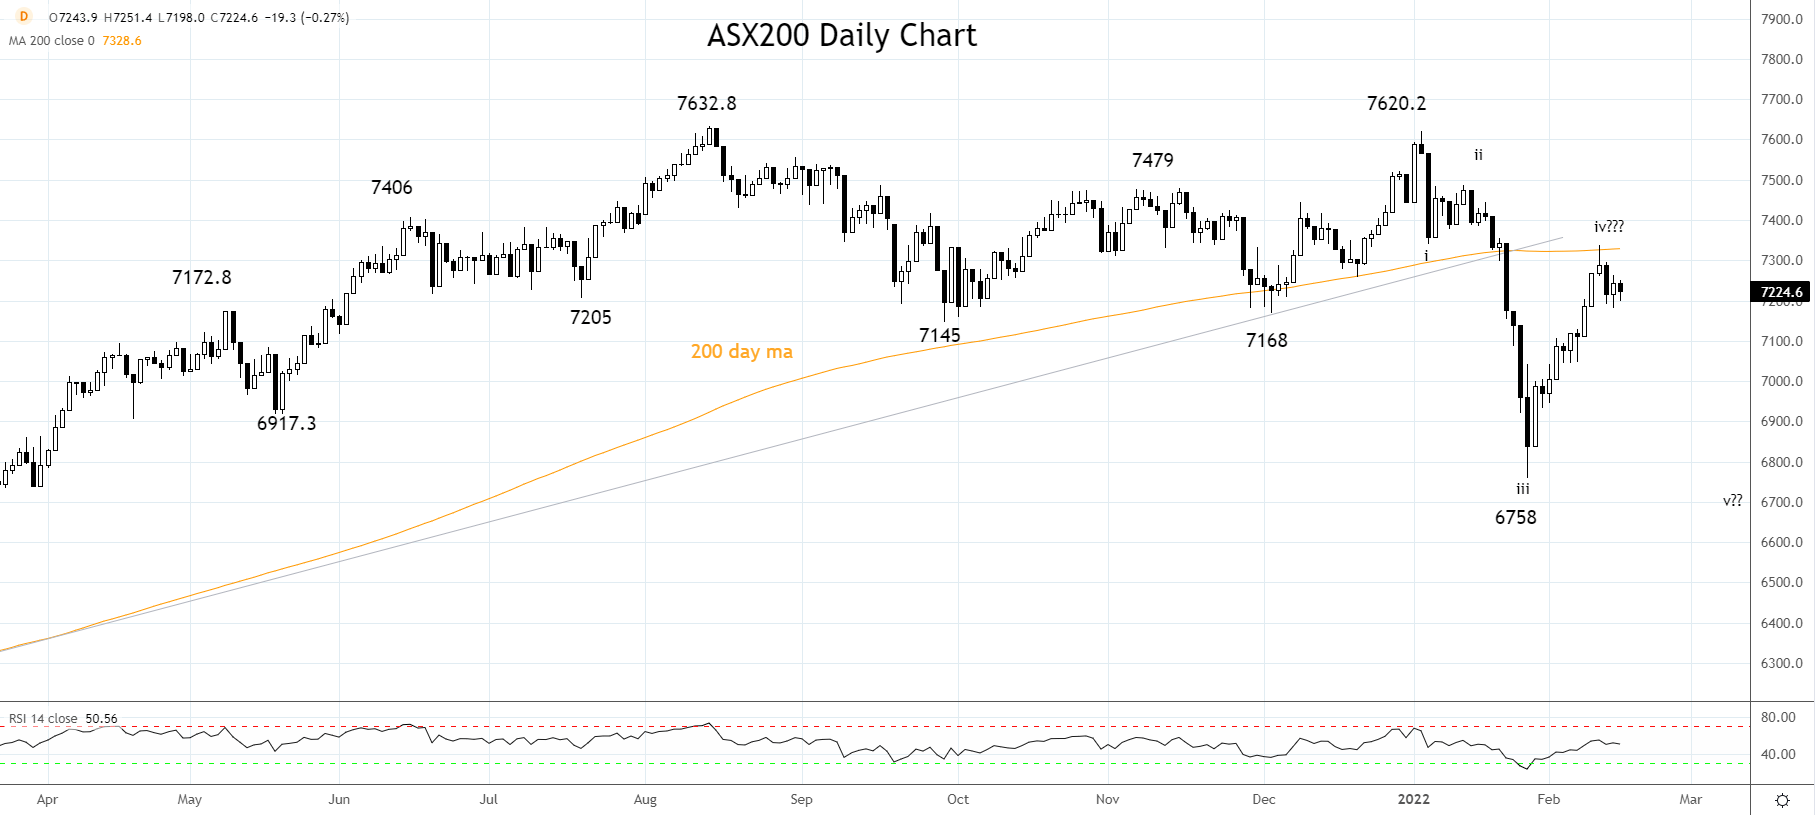
However, on the daily chart, it is possible that the rally from the 6758 low is a corrective Wave iv and that a retest of the 6758 will follow to complete an impulsive five-wave decline.
As such, we suggest using the 200 day moving average 7327ish as the pivot to keep it clean. Bearish below, bullish on consecutive daily closes above.
Source Tradingview. The figures stated areas of February 15th, 2022. Past performance is not a reliable indicator of future performance. This report does not contain and is not to be taken as containing any financial product advice or financial product recommendation
How to trade with City Index
You can trade with City Index by following these four easy steps:
- Open an account, or log in if you’re already a customer
• Open an account in the UK
• Open an account in Australia
• Open an account in Singapore
- Search for the company you want to trade in our award-winning platform
- Choose your position and size, and your stop and limit levels
- Place the trade
The minutes showed that while the RBA was pleased the economy was making progress towards its economic goals, the central bank would remain patient.
“While inflation had picked up, members agreed it was too early to conclude that it was sustainably within the target band.”
Within the final paragraph, the RBA noted that “Wages growth also remained modest, and it was likely to be some time before aggregate wages growth would be at a rate consistent with inflation being sustainably at target.”
Attention now turns to Thursday's jobs data for January, expected to see a 15K fall in employment as economic activity softened following the Omicron outbreak. The unemployment rate is expected to fall to a new cycle low of 4.1%, cushioned by a decline in the participation rate.
Reflecting the low unemployment rate, stronger growth, and inflation numbers in 2022, there are five 25bp interest rate hikes priced into the Australian rates market before the end of the year. The first-rate hike is priced to come in June after the Federal Election in May.
On top of the pricing of rate hikes, the Australian equity market is digesting, amongst other things 1H 2022 earnings reports, surging energy prices, and a possible invasion of Ukraine by Russia.
This probably explains why the technical picture in the ASX200 is also a little convoluted. On the Weekly chart below, it appears the ASX200 completed a three-wave correction from the August 7632 high at the 6758 low. The recent rally above 7200 suggests the uptrend has resumed.
However, on the daily chart, it is possible that the rally from the 6758 low is a corrective Wave iv and that a retest of the 6758 will follow to complete an impulsive five-wave decline.
As such, we suggest using the 200 day moving average 7327ish as the pivot to keep it clean. Bearish below, bullish on consecutive daily closes above.
Source Tradingview. The figures stated areas of February 15th, 2022. Past performance is not a reliable indicator of future performance. This report does not contain and is not to be taken as containing any financial product advice or financial product recommendation
- Open a Forex.com account, or log in if you’re already a customer.
- Search for the pair you want to trade in our award-winning platform.
- Choose your position and size, and your stop and limit levels.
- Place the trade.
Related tags:
Latest market news




The complete CFD trading experience
Award-winning platforms, competitive spreads, low commissions and dedicated support.
We live and breathe the markets and are dedicated to helping traders realise their ambitions as we continue to set the industry bar.
Economic calendar
Web Trader platform
Our sophisticated web-based platform is packed with features.
Related articles

Brazil Elections: Is Investor Confidence Beginning to Fade?
One of the most relevant events for emerging markets in recent sessions has been the outcome of Brazil’s presidential election. Following Lula da Silva’s victory in the second round, investor sentiment began to deteriorate noticeably. This can be observed in both the iShares MSCI Brazil ETF and the VanEck Brazil Small-Cap ETF, two important benchmarks for tracking the Brazilian equity market, both of which have posted declines of more than 15% at the start of the week.

ASX 200 Outlook: A Rates Trade Disguised as a Stock Market?
Australian bond futures have exhibited a far stronger relationship with the ASX 200 than Wall Street over recent months. Now both markets are displaying remarkably similar price structures.


Dow Jones Analysis: Is the DJIA Making a Comeback?
Recent trading sessions have become increasingly relevant for the Dow Jones, as the index has started to regain bullish momentum heading into the end of the week. Over the last three sessions, the DJIA has advanced by more than 0.6%, allowing buying pressure to regain prominence and raising the possibility of a more consistent short-term recovery.
StoneX Europe Ltd may make third party material available on this website which may contain information included but not limited to the conditions of financial markets. The material is for information purposes only and does not contain, and should not be construed as containing, investment advice and/or investment recommendation and/or an investment research and/or an offer of or solicitation for any transactions in financial instruments; any decision to enter into a specific transaction shall be made by the client following an assessment by him/her of their situation.
StoneX Europe Ltd makes no representation or warranty and assumes no liability as to the accuracy or completeness of the information provided, nor any loss arising from any investment based on a recommendation, forecast or other information supplied. You should always seek independent advice as to your suitability to speculate in any related markets and your ability to assume the associated risks, if you are at all unsure. We are not under any obligation to update any such material. Any opinion made may be personal to the author and may not reflect the opinion of StoneX Europe Ltd.