








AU employment data leaves no room for RBA easing: AUD/USD, AUD/CHF
Over the past few hours we have seen the Fed hint at multiple cuts this year, and Australian employment data outperform to send AUD/USD above 66c.
Share this:

Australian employment report highlights
- Unemployment fell to 3.7% (4% prior, below its 12-month MA)
- 116.5k jobs added (78.2k of which were full time)
- AUD/USD broke convincingly above 66c as bears likely trimmed dovish-RBA bets
- AU 3-year bond fell 9bp initially (now down -6bp) and yields rose
We’re seeing quite a bit of noise in Australia’s employment figures of late, which is making it difficult to interpret the trend. December’s figures revealed a surprise 110.8k slashing of full-tome jobs, before unemployment rose to a 2-year high of 4% in January which increased the odds of RBA easing.
So it did come as a surprise to see job growth rise 116.5k in February and unemployment fall back to 3.7%. The fact that 78.2k full-time jobs were added certainly helps soften the blow from December’s FT culling, but it does bring into question which outlier numbers we should be focussing on; the good or the bad?
Well, given we just had a surprisingly dovish FOMC meeting, today’s strong employment figures have at least seen some AUD/USD bears run for cover. As these numbers aren’t exactly what we’d expect to see from an economy that is due a rate cut any time soon. Services PMI also expanded at a faster pace than expected earlier today. Therefore, I’ll stick with my observation from Tuesday’s RBA meeting’ a 3.5% cash rate is set to stay for some time.
AUD/USD technical analysis:
The Australian dollar broke convincingly above 66c following the employment report, and has now fully recovered losses sustained over the past week. The bullish momentum of the past two days likely invalidates any hope of the potential head and shoulders pattern I noted in today’s Asian open report.
The 1-hour chart shows strong bullish momentum heading into 0.6620. It trades above the high-volume node of the prior decline and seemingly on track to head for the 0.6650/60 region. Yet this is not an easy market to be bullish on at these levels, from a reward to risk perspective.
Bulls could either revert to very low times to seek bullish continuation pattern on the assumption AUD/USD will continue higher. Personally, I’d prefer to see a retracement on the 1-hour timeframe before reconsidering its potential for a swing trade long, above or around 66c or the weekly pivot point.
AUD/CHF technical analysis:
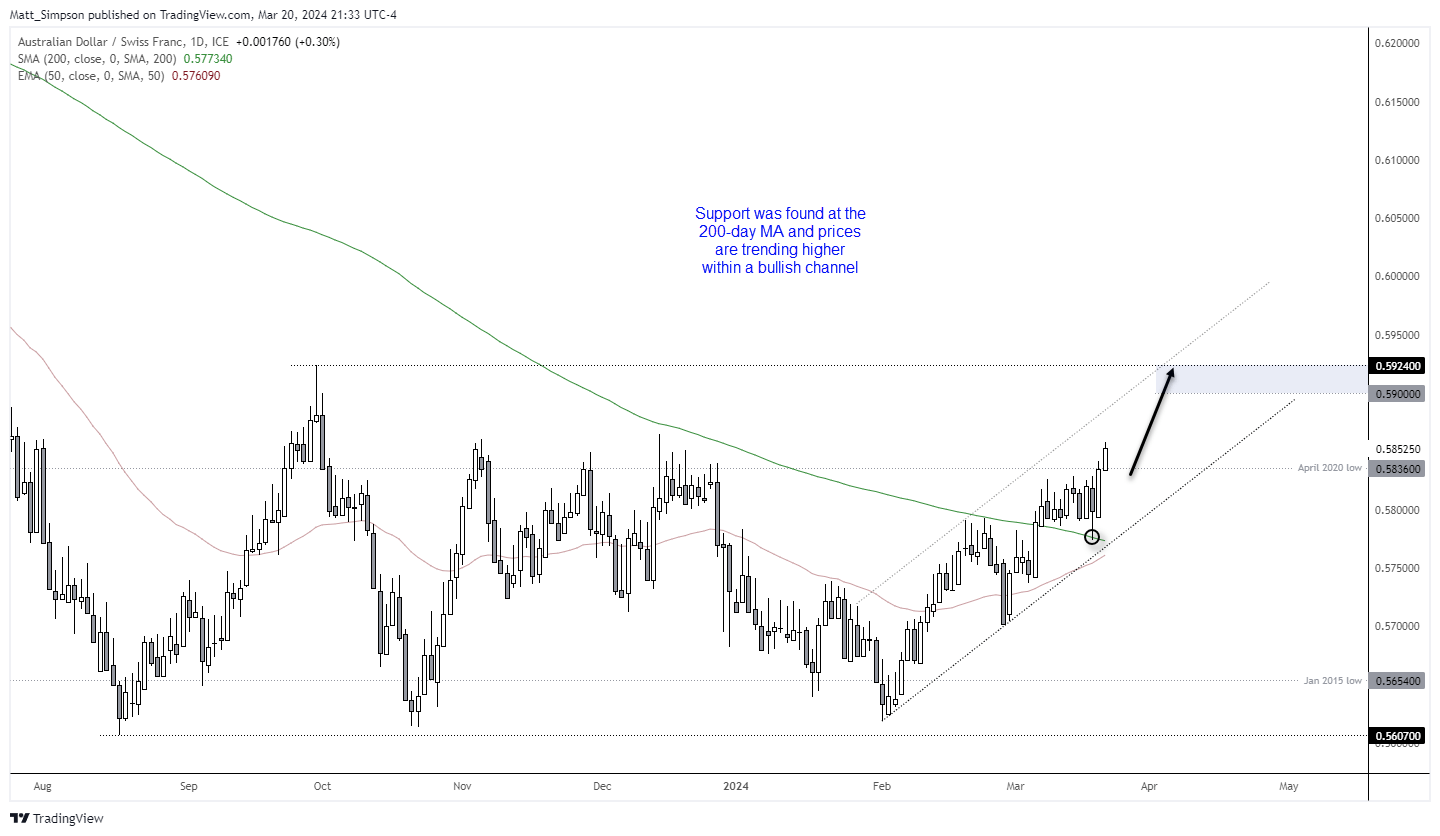
This is not a pair I look at often, but a divergent theme could be building on AUD/CHF to favour long positions over the coming week/s. The cross has been within an established downtrend on the weekly chart since 2017, although a triple bottom formed just above 0.5600 and momentum has pushed prices up to the top of its sideways range.
With the RAB set to hold at a relatively high 4.35%, the SNB are likely to cut and signal easing first. They just so happen to be announcing their monetary policy decision later today.
The daily chart shows that a bullish trend has emerged within a rising channel, and support was found at the 200-day MA ahead of a break above the April 2020 low. From here, the bias is to seek dips within the channel and target 0.5900 or the upper trendline – whichever comes first.
-- Written by Matt Simpson
Follow Matt on Twitter @cLeverEdge
How to trade with City Index
You can trade with City Index by following these four easy steps:
- Open an account, or log in if you’re already a customer
• Open an account in the UK
• Open an account in Australia
• Open an account in Singapore
- Search for the market you want to trade in our award-winning platform
- Choose your position and size, and your stop and limit levels
- Place the trade
Related tags:
Latest market news




The complete CFD trading experience
Award-winning platforms, competitive spreads, low commissions and dedicated support.
We live and breathe the markets and are dedicated to helping traders realise their ambitions as we continue to set the industry bar.
Economic calendar
Web Trader platform
Our sophisticated web-based platform is packed with features.
Related articles
USD/JPY Weekly Outlook: Volatility Has Left the Building
The yen has ignored broad dollar weakness, falling Treasury yields and renewed market turbulence. Yet its relationship with US interest rates remains intact. So why is USD/JPY going absolutely nowhere fast?
Swiss Franc Forecast: USD/CHF Seven-Week Rally Reverses From Yearly Highs 10 16 2026
A sharp rejection from fresh highs has shifted momentum in favor of USD/CHF bears, raising the stakes for a critical support test.


Nasdaq 100 forecast: Tech stocks not out of woods yet
US index futures pushed higher in the first half of Friday’s session, taking cues from a strong performance from European equities. Both European and US equity futures extending yesterday’s impressive recovery after the sharp sell-off earlier in the week. But the lingering concerns around the AI investment cycle remain, while bond markets were easing lower again, lifting yields.

StoneX Europe Ltd may make third party material available on this website which may contain information included but not limited to the conditions of financial markets. The material is for information purposes only and does not contain, and should not be construed as containing, investment advice and/or investment recommendation and/or an investment research and/or an offer of or solicitation for any transactions in financial instruments; any decision to enter into a specific transaction shall be made by the client following an assessment by him/her of their situation.
StoneX Europe Ltd makes no representation or warranty and assumes no liability as to the accuracy or completeness of the information provided, nor any loss arising from any investment based on a recommendation, forecast or other information supplied. You should always seek independent advice as to your suitability to speculate in any related markets and your ability to assume the associated risks, if you are at all unsure. We are not under any obligation to update any such material. Any opinion made may be personal to the author and may not reflect the opinion of StoneX Europe Ltd.