



Aussie Dollar Gains as RBA Hike Bets Surge
RBA hike pricing has surged as inflation, spending and GDP all beat expectations, adding to tailwinds for the AUD from stronger metals prices.
Share this:

- Australian economic surprises turn positive
- RBA September hike probability jumps to 76%
- EUR/AUD, GBP/AUD bears eye lower levels
- AUD/USD driven by US rates, risk appetite
The Aussie dollar has benefited from recent strength in metals prices and a run of stronger-than-expected economic data, helping expectations for an RBA rate hike later this month build sharply. That has seen it outperform against the European crosses, pushing EUR/AUD and GBP/AUD towards range lows.
AUD/USD is a different story. It remains the US rate show with a side of risk appetite, putting greater emphasis on incoming US data over the coming days, headlined by August nonfarm payrolls on Friday.
Data strength lifts RBA pricing
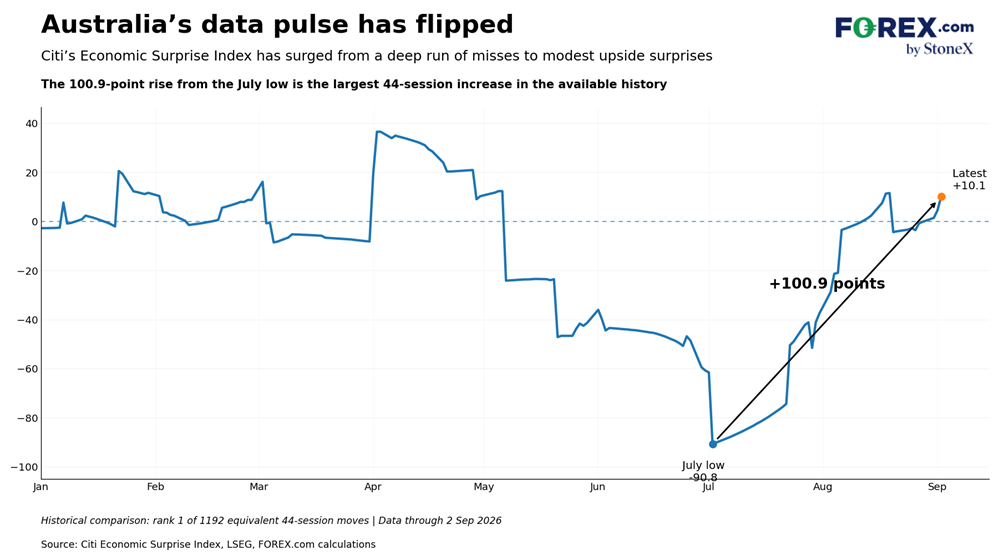
A slew of stronger-than-expected economic data is providing a tailwind for the Aussie, with a string of upside surprises in key releases over the past week. Inflation and household spending both came in hot in July, while GDP also beat both market and RBA expectations in the June quarter, expanding 0.4%, leaving growth from a year earlier up 2.1%.
Source: LSEG, FOREX.com
The improvement in the local data pulse is demonstrated by Citi’s Economic Surprise Index, which has flipped positive, sitting at +10.1. While not extreme by historical standards, what is notable is how dramatic the turnaround has been from the low seen in July, with the index surging 100.9 points in just 44 trading sessions, the largest increase over an equivalent period seen across the past five years.
Citi’s Economic Surprise Index measures how economic data prints relative to median economists’ forecasts, placing greater emphasis on releases that tend to generate more market volatility and those delivered more recently.
Source: TradingView, FOREX.com
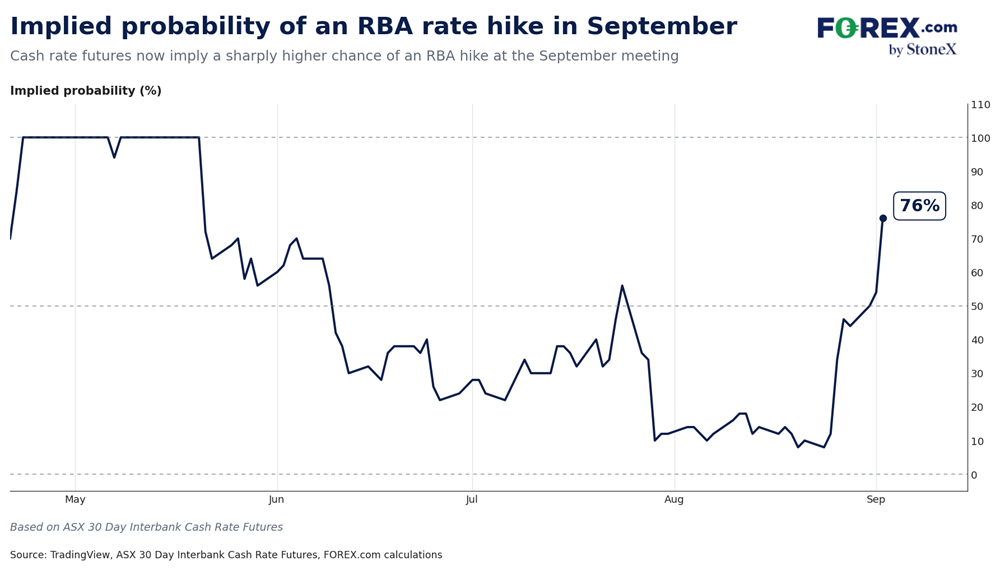
And with the local data pulse picking up, so too have expectations for an RBA rate hike on September 29, with the implied probability from cash rate futures rising to 76%, up sharply from less than 10% in late August. By the time the RBA’s November meeting arrives, markets have more than one full hike priced, with around a one-in-five chance of a second increase at that meeting.
While Australia is not alone in seeing a sharp improvement in economic data relative to expectations, with similar moves seen elsewhere including Europe, what makes the RBA repricing different is that it may be hiking for the “right” reasons. Demand is still robust, adding to inflationary pressure being generated by the energy price spike caused by disruptions in the Gulf.
Elsewhere, the case for tighter policy looks less compelling, with central banks effectively trying to respond to a supply shock whose duration remains unknown, given the risk of second-round inflationary effects the longer high energy prices persist. That divergence, alongside recent strength in commodity prices, has provided a tailwind for the Aussie against the major European currencies.
EUR/AUD bears eye lower levels
Source: TradingView
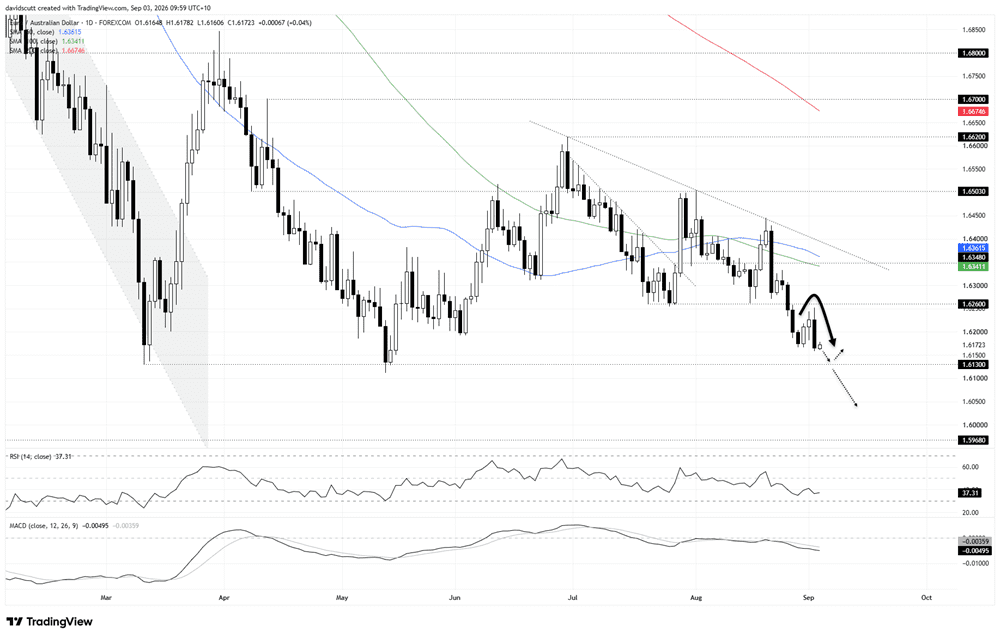
Looking at EUR/AUD on the daily timeframe, Thursday delivered a bearish engulfing candle, reversing hard after failing as it approached former horizontal support at 1.6260. That saw the pair close at the lowest level since May.
With the oscillators favouring shorts over longs, that points to a potential retest of support at 1.6130 in the short term. A break beneath 1.6130 would open something akin to an air pocket for the pair, with very little visible support evident until 1.5968, the swing low set back in November 2024. Overhead, 1.6260 remains the first level of note, along with the confluence of the 50 and 100-day moving averages around 1.6350.
GBP/AUD tests June lows
Source: TradingView
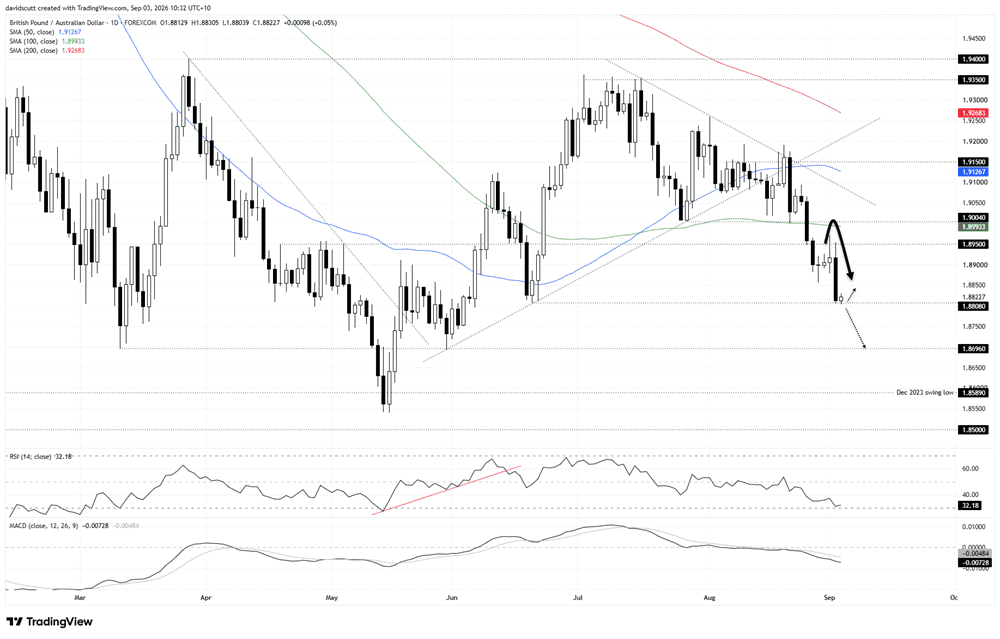
Turning to GBP/AUD, the move was even more definitive on Thursday, with a big reversal seeing the pair test support at 1.8808, the swing low set in mid-June. That is now the immediate level of focus underneath where the pair trades, with a break pointing to the potential for a move down to support at 1.8696.
Overhead, the pair failed twice to clear resistance at 1.8950, making that the key level to watch, although there may be some residual resistance around 1.8860, where the pair bottomed on August 28 before staging a minor bounce.
The message from the oscillators favours selling into strength and downside breaks, with RSI (14) continuing to set lower highs and sitting just above oversold territory at 32. MACD confirms that message, having staged a bearish crossover and continuing to diverge from the signal line in negative territory, confirming downside momentum continues to build.
AUD/USD range holds into payrolls
Source: TradingView, FOREX.com
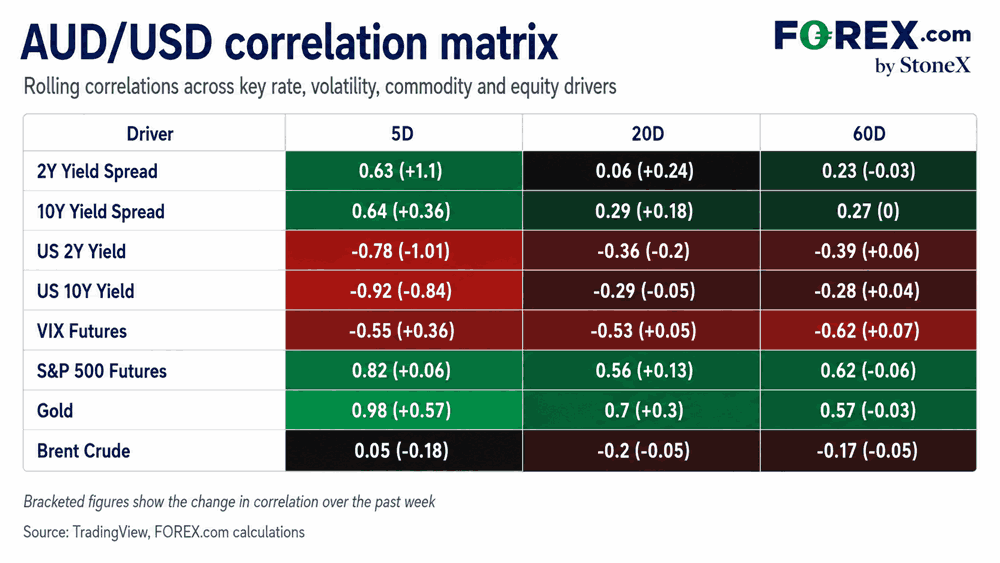
While the lift in hawkish RBA pricing has helped the Aussie against the European names, AUD/USD remains very much a US rates and risk appetite show, as demonstrated by the correlation matrix above. The Aussie continues to maintain strong inverse relationships with both front and longer-dated US yields, with those correlations stronger than those seen with Australian-US two-year and 10-year yield spreads.
Risk appetite also remains important, as shown by the relationships with VIX futures and S&P 500 futures. Gold could also be classified in that basket, although broader strength across metals markets has likely underpinned the Aussie’s recent movements.
As such, that puts emphasis on the ISM Services PMI release later in the session, with payrolls on Friday a far more significant volatility event given the risk posed to Fed pricing and risk appetite. Both should be firmly on the radar for anyone trading the pair.
Source: TradingView
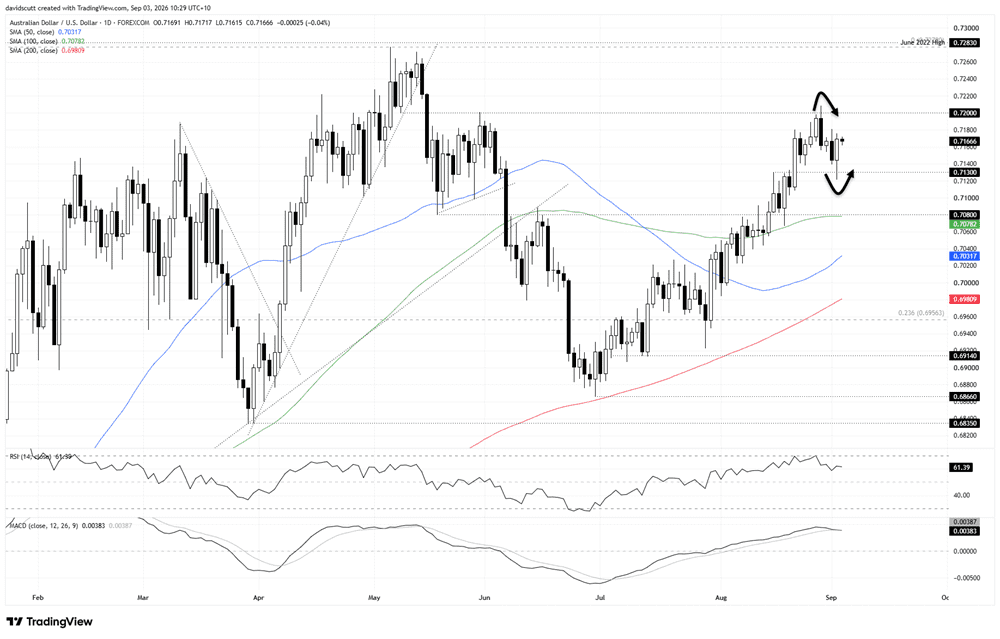
AUD/USD remains in a strong bullish trend from the lows set in June, although more recently it has settled into a sideways range, capped by resistance above 0.7200 with support kicking in from 0.7130. That is the immediate range to focus on.
Above 0.7200, bulls will be eyeing off a potential retest of the June 2022 high at 0.7283, where the pair stalled in April earlier this year. Underneath 0.7130, 0.7080 is now aligned with the 100-day simple moving average, making it a level of note below.
The oscillators are delivering a more cautious message to bulls rather than an outright bearish signal. RSI (14) is pushing lower but remains above the neutral 50 level, while MACD has just staged a bearish crossover but remains in positive territory. At the very least, that suggests bulls should be cautious about taking on too much risk around current levels and be selective on trade entry points.
Latest market news




The complete CFD trading experience
Award-winning platforms, competitive spreads, low commissions and dedicated support.
We live and breathe the markets and are dedicated to helping traders realise their ambitions as we continue to set the industry bar.
Economic calendar
Web Trader platform
Our sophisticated web-based platform is packed with features.
Related articles
USD/JPY forecast: hot US CPI lifts the pair above its 200-day average
Hotter-than-expected US inflation has pushed USD/JPY above its 200-day moving average, putting 160 and the risk of Bank of Japan intervention back in focus. The breakout still needs to hold, and a failure could send the pair sharply lower.

Australian Dollar Technical Outlook: AUD/USD Trend Break Faces Immediate Test 10 14 2026
AUD/USD is trying to hold a fresh trend break as renewed selling pressure tests whether the recovery can extend beyond the recent rebound.

Dow Jones outlook: CPI, oil and yields put the rally to the test
US index futures rebounded in the first half of Wednesday’s session, along with European indices ahead of the release of US CPI. Some slightly dovish remarks from the Fed’s Williams seem to have helped sentiment a little, but whether those comments will be backed by data remains to be seen. While slightly hotter than expected inflation data shouldn’t be enough for markets to price in an October Fed hike with more than a coin flip probability, it can nonetheless reinforce expectations of further tightening later in the year.
StoneX Europe Ltd may make third party material available on this website which may contain information included but not limited to the conditions of financial markets. The material is for information purposes only and does not contain, and should not be construed as containing, investment advice and/or investment recommendation and/or an investment research and/or an offer of or solicitation for any transactions in financial instruments; any decision to enter into a specific transaction shall be made by the client following an assessment by him/her of their situation.
StoneX Europe Ltd makes no representation or warranty and assumes no liability as to the accuracy or completeness of the information provided, nor any loss arising from any investment based on a recommendation, forecast or other information supplied. You should always seek independent advice as to your suitability to speculate in any related markets and your ability to assume the associated risks, if you are at all unsure. We are not under any obligation to update any such material. Any opinion made may be personal to the author and may not reflect the opinion of StoneX Europe Ltd.