





Canadian Dollar Forecast: USD/CAD Breakdown Stall into Elections
USD/CAD bears have come on quickly but for the past three weeks have largely stalled at support of 1.3846.
Share this:

Canadian Dollar, USD/CAD Talking Points:
- April has been a very bearish month for USD/CAD but the bulk of those losses were within the first 11 days. Since then, USD/CAD has held support at the 1.3846 level which remains in-play into the weekend.
- Monday brings Canadian elections, and Mark Carney is currently favored to win. Canada has six time zones and polls close at 9:30 PM, after which votes are tallied. Preliminary results may be available shortly after polls close and official results confirmed within a few days after.
- I’ll be looking into USD/CAD price action in the Tuesday webinar and you’re welcome to join: Click here for registration information.
The short-side trend has come on quickly in USD/CAD, and from a longer-term perspective this continues the range-bound backdrop that’s been in the pair for the past nine-plus years. But much like the US Dollar, the bulk of those losses were relegated to the first eleven days of the month, with USD/CAD spinning its wheels for much of the time since and with the 1.3846 level continuing to hold the lows. I had looked at that level on the 11th as that price was a swing high from a year ago; and for the past three weeks this has been support.
USD/CAD Weekly Chart
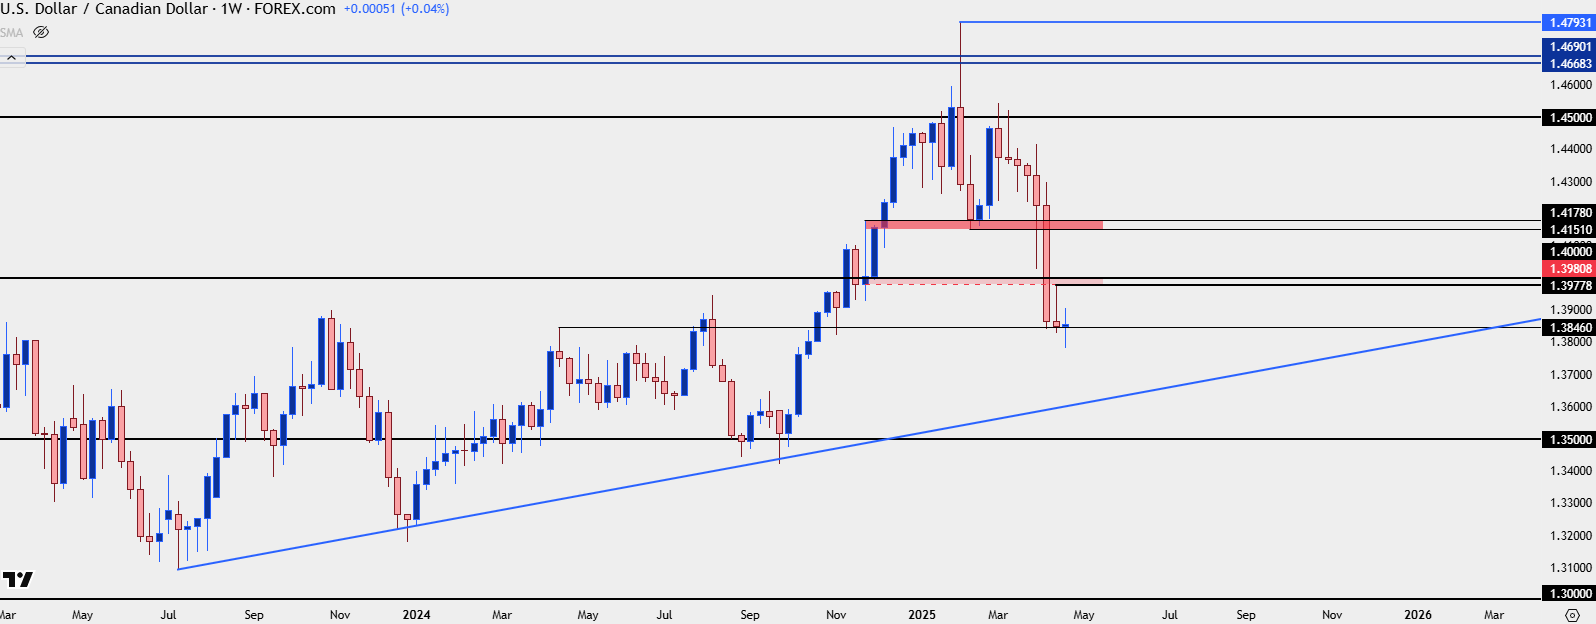 Chart prepared by James Stanley; data derived from Tradingview
USD/CAD Shorter-Term Strategy
When that 1.3846 level came into play earlier in the month, RSI on the daily was nearing oversold territory and given how aggressively bears had pushed the pair through the 1.4000 psychological level, it made for a difficult trend to chase. I talked about that in the article published at the time, instead focusing on resistance around the 1.4000 handle. And as I said then, ideally, sellers wouldn’t even allow for a 1.4000 test as bearish anticipation would hold resistance below the psychological level. So, I spanned that price down to a prior swing of 1.3980 to look for a resistance zone. Even that couldn’t come into play, however, as the swing high from that bounce was 2.2 pips shy of 1.3980, with sellers taking another swing shortly after.
But since then, bears haven’t been able to break much fresh ground as they’ve continually been caught at the 1.3846 level and that’s allowed for a couple of reversal items to show on the chart. First is a diverging RSI element with higher-lows on RSI to go along with lower-lows on price; and from a price action perspective a weak falling wedge has formed.
These items don’t necessarily mean that a low is in-place, and that price will reverse for a long time. But it does highlight that chasing the move lower from here could prove challenging and, instead, pullbacks with tests of resistance could be a more attractive way of trying to work with the move.
For that, I’m sticking to the same 1.4000 test and this time, I’d be willing to accept a test through the big figure. The more important matter would be a daily close as I’d want to see sellers respond to that test in a noticeable fashion to illustrate that they might be ready to run the trend lower again. If they can’t – then the next zone of resistance comes into play at 1.4151-1.4178. This was a big zone of resistance turned support when the pair was ranging, so another test there with a show of a swing high could make the prospect of bearish continuation attractive again.
USD/CAD Daily Price Chart
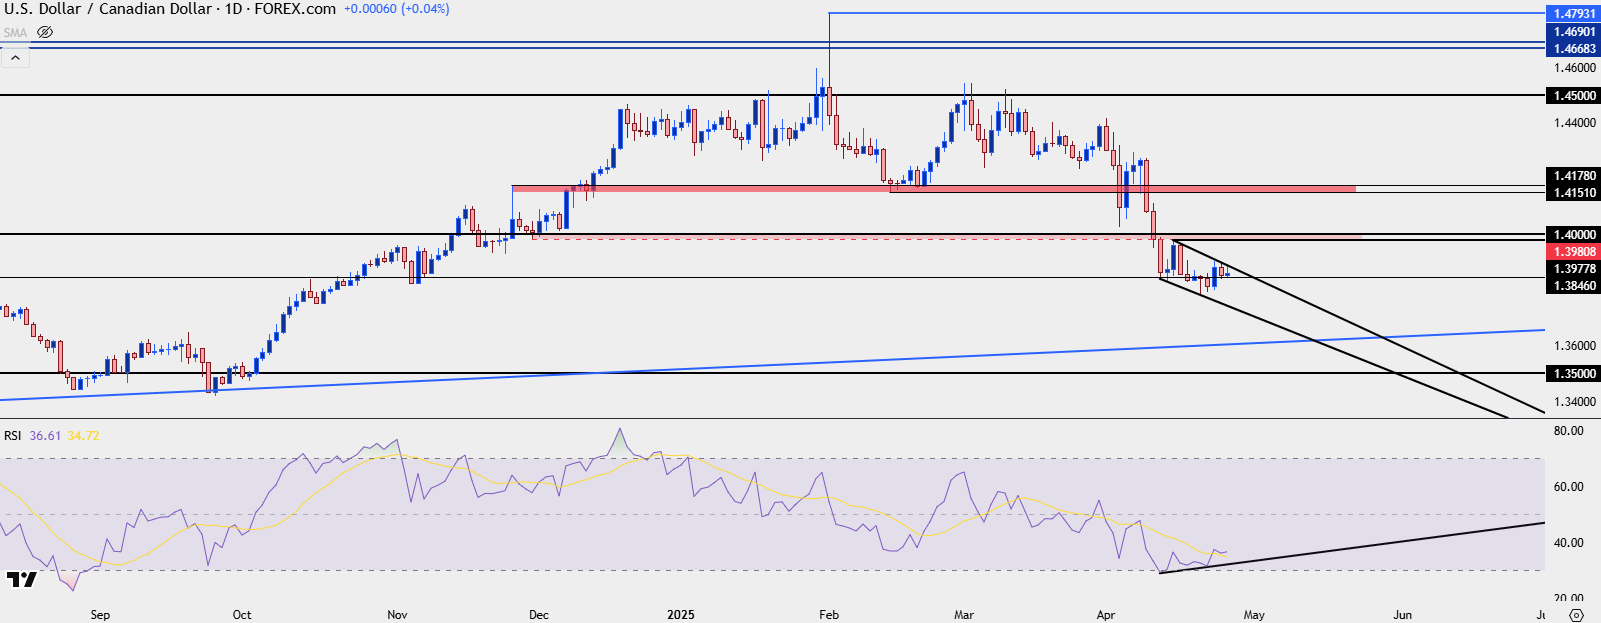 Chart prepared by James Stanley; data derived from Tradingview
--- written by James Stanley, Senior Strategist
Canadian Dollar, USD/CAD Talking Points:
- April has been a very bearish month for USD/CAD but the bulk of those losses were within the first 11 days. Since then, USD/CAD has held support at the 1.3846 level which remains in-play into the weekend.
- Monday brings Canadian elections, and Mark Carney is currently favored to win. Canada has six time zones and polls close at 9:30 PM, after which votes are tallied. Preliminary results may be available shortly after polls close and official results confirmed within a few days after.
- I’ll be looking into USD/CAD price action in the Tuesday webinar and you’re welcome to join: Click here for registration information.
The short-side trend has come on quickly in USD/CAD, and from a longer-term perspective this continues the range-bound backdrop that’s been in the pair for the past nine-plus years. But much like the US Dollar, the bulk of those losses were relegated to the first eleven days of the month, with USD/CAD spinning its wheels for much of the time since and with the 1.3846 level continuing to hold the lows. I had looked at that level on the 11th as that price was a swing high from a year ago; and for the past three weeks this has been support.
USD/CAD Weekly Chart
USD/CAD Shorter-Term Strategy
When that 1.3846 level came into play earlier in the month, RSI on the daily was nearing oversold territory and given how aggressively bears had pushed the pair through the 1.4000 psychological level, it made for a difficult trend to chase. I talked about that in the article published at the time, instead focusing on resistance around the 1.4000 handle. And as I said then, ideally, sellers wouldn’t even allow for a 1.4000 test as bearish anticipation would hold resistance below the psychological level. So, I spanned that price down to a prior swing of 1.3980 to look for a resistance zone. Even that couldn’t come into play, however, as the swing high from that bounce was 2.2 pips shy of 1.3980, with sellers taking another swing shortly after.
But since then, bears haven’t been able to break much fresh ground as they’ve continually been caught at the 1.3846 level and that’s allowed for a couple of reversal items to show on the chart. First is a diverging RSI element with higher-lows on RSI to go along with lower-lows on price; and from a price action perspective a weak falling wedge has formed.
These items don’t necessarily mean that a low is in-place, and that price will reverse for a long time. But it does highlight that chasing the move lower from here could prove challenging and, instead, pullbacks with tests of resistance could be a more attractive way of trying to work with the move.
For that, I’m sticking to the same 1.4000 test and this time, I’d be willing to accept a test through the big figure. The more important matter would be a daily close as I’d want to see sellers respond to that test in a noticeable fashion to illustrate that they might be ready to run the trend lower again. If they can’t – then the next zone of resistance comes into play at 1.4151-1.4178. This was a big zone of resistance turned support when the pair was ranging, so another test there with a show of a swing high could make the prospect of bearish continuation attractive again.
USD/CAD Daily Price Chart
--- written by James Stanley, Senior Strategist
Related tags:



The complete CFD trading experience
Award-winning platforms, competitive spreads, low commissions and dedicated support.
We live and breathe the markets and are dedicated to helping traders realise their ambitions as we continue to set the industry bar.
Economic calendar
Web Trader platform
Our sophisticated web-based platform is packed with features.
Related articles

Canadian Dollar Analysis: USD/CAD Returns to July Highs Ahead of NFP
The Canadian dollar continues to face one of its most challenging environments in recent months when it comes to maintaining strength against the U.S. dollar. The weakness of the Canadian currency is clearly reflected in USD/CAD, which has now recorded nine consecutive bullish sessions and gained more than 1.7% during that period.


Gold Price Outlook: XAU/USD Resistance at $4200 Sets Up for NFP
It was a strong sell-off to start the week in gold and despite a Tuesday bounce, sellers are continuing to push following a resistance hit at the $4200 level.

Canadian Dollar Forecast: USD/CAD Four-Week Rally Eyes Yearly Highs 9 30 2026
USD/CAD has advanced in 14 of the past 15 sessions, but stretched momentum raises the stakes as major resistance and NFP come into focus.

StoneX Europe Ltd may make third party material available on this website which may contain information included but not limited to the conditions of financial markets. The material is for information purposes only and does not contain, and should not be construed as containing, investment advice and/or investment recommendation and/or an investment research and/or an offer of or solicitation for any transactions in financial instruments; any decision to enter into a specific transaction shall be made by the client following an assessment by him/her of their situation.
StoneX Europe Ltd makes no representation or warranty and assumes no liability as to the accuracy or completeness of the information provided, nor any loss arising from any investment based on a recommendation, forecast or other information supplied. You should always seek independent advice as to your suitability to speculate in any related markets and your ability to assume the associated risks, if you are at all unsure. We are not under any obligation to update any such material. Any opinion made may be personal to the author and may not reflect the opinion of StoneX Europe Ltd.