






Crude Oil Update: Returning to the 2024 Starting Point
Crude Oil Update: With both the Chinese and US economies reporting economic statistics previously seen in 2009, bearish pressures have driven oil prices back towards the 2024 lows, raising concerns about a potential decline into the $60 price range.
Share this:

Key Points:
- US Job Sector Revision Matches 2009 Statistics
- Crude Oil Inventories Drop Below Expectations
- Flash Manufacturing and Services PMIs in Focus Today
- Technical Analysis
Recent data from the Chinese economy has hit lows not seen since 2009, and the latest revision of US job market growth aligns with those 2009 figures as well, pushing oil prices back to their 2024 starting point. Despite a significant drop in crude oil inventories—falling to 4.6M barrels, well below the expected 2M barrels—the oil market's trend remains more influenced by the broader global economic outlook.
Today's Flash Manufacturing PMI reports from France and Germany fell below expectations, indicating contraction in their industrial sectors. Meanwhile, France’s Flash Services PMI stood out by retesting April 2023 highs, highlighting the ongoing challenges in the services sector amid disinflationary efforts. Attention now turns to upcoming PMI results from the UK and US, which will provide further insight into industrial activity ahead of Powell’s address at the Jackson Hole Symposium tomorrow.
Technical Outlook
Crude Oil Update: USOIL – 3 Day Time Frame - Log Scale
Source: Tradingview
As oil prices return to yearly lows and the mid-channel zone, the trend faces a critical juncture: either continuing its decline towards the $60 price range or stabilizing above the $70 mark until a bullish catalyst emerges.
Current pullbacks are confined within the $75 and $80 range, with continued bearish projections below the $70 mark aligning with Dec 2023 lows near the 69 zone, and further aligning with zones 65, 60, and 58.
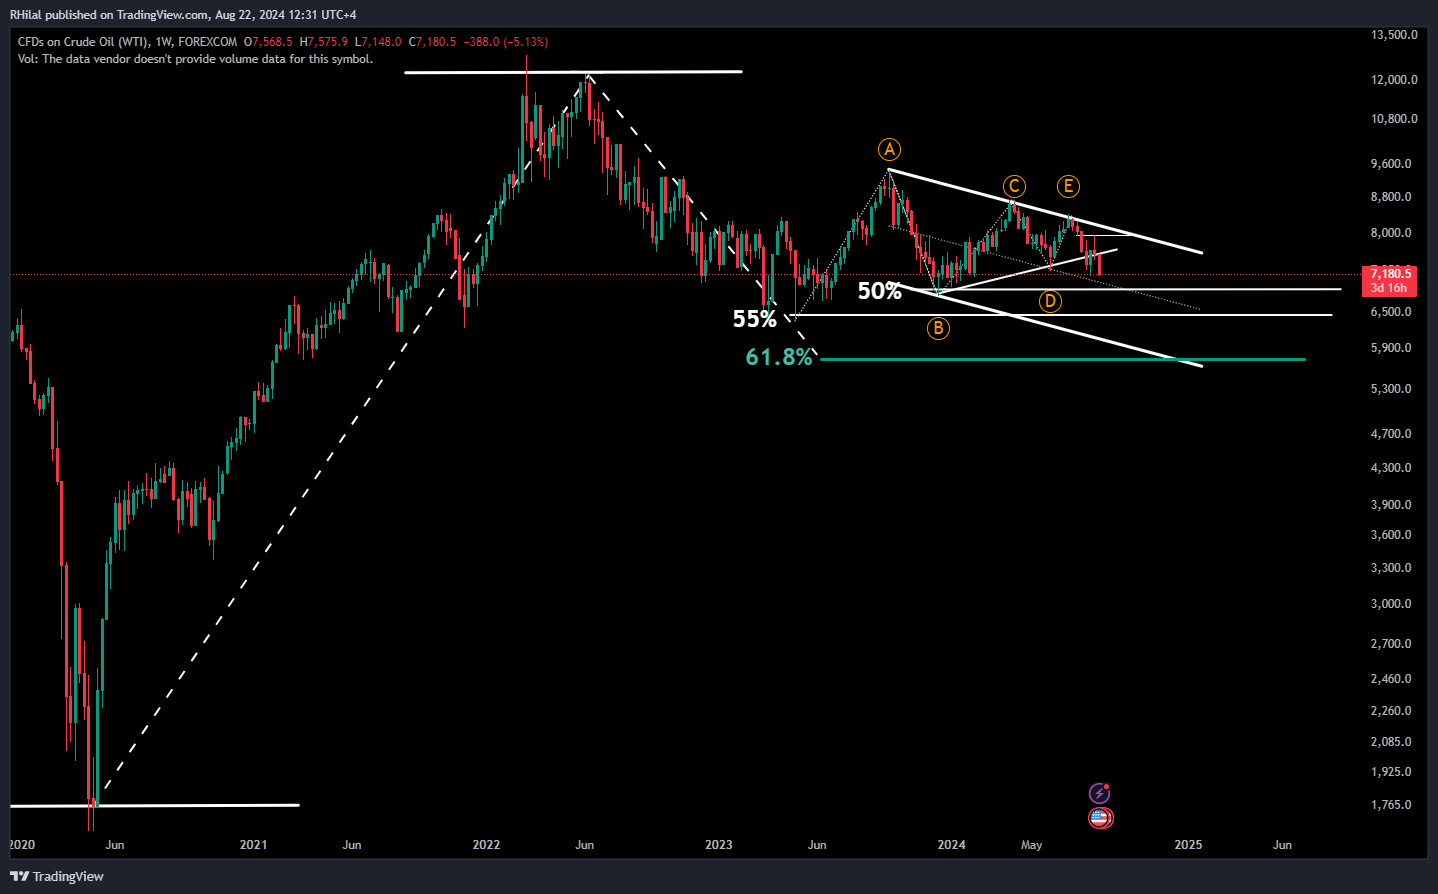
Crude Oil Update: USOIL – Weekly Time Frame - Log Scale
Source: Tradingview
From a weekly time-frame perspective, oil is currently hovering near the 50% Fibonacci retracement level of the uptrend that spanned from the lows of April 2020 to the highs of June 2022. This 50% retracement level, situated around the $70 zone, serves as a crucial support area, indicating potential stability before the trend continues towards the next Fibonacci levels. These levels include the 55% retracement at the $65-$64.80 zone and the golden 61.8% retracement at the $58-$57.70 zone, respectively.
In addition to the bearish projections, close attention is being paid to any potential market interventions or bullish catalysts that could trigger unexpected upturns.
--- Written by Razan Hilal, CMT – on X: @Rh_waves
Related tags:




The complete CFD trading experience
Award-winning platforms, competitive spreads, low commissions and dedicated support.
We live and breathe the markets and are dedicated to helping traders realise their ambitions as we continue to set the industry bar.
Economic calendar
Web Trader platform
Our sophisticated web-based platform is packed with features.
Related articles

Gold Price Short-term Outlook: XAU/USD Holds Critical Support as Breakout Nears 10 15 2026
Gold is consolidating after a steep selloff, with momentum divergence raising the stakes for the next move ahead of the Fed decision.


S&P 500 Forecast: SPX Falls after hot inflation and as AI debt concerns mount
U.S. stocks are falling after hotter-than-expected readings on producer prices and retail sales, while concerns over AI-related debt are also mounting.


Silver Analysis: XAG/USD Falls Back to Annual Lows
Recent sessions have been particularly challenging for silver prices in the short term. Selling pressure has intensified considerably, resulting in three consecutive losing sessions and pushing the metal to a decline of nearly 8.5% over this period.

StoneX Europe Ltd may make third party material available on this website which may contain information included but not limited to the conditions of financial markets. The material is for information purposes only and does not contain, and should not be construed as containing, investment advice and/or investment recommendation and/or an investment research and/or an offer of or solicitation for any transactions in financial instruments; any decision to enter into a specific transaction shall be made by the client following an assessment by him/her of their situation.
StoneX Europe Ltd makes no representation or warranty and assumes no liability as to the accuracy or completeness of the information provided, nor any loss arising from any investment based on a recommendation, forecast or other information supplied. You should always seek independent advice as to your suitability to speculate in any related markets and your ability to assume the associated risks, if you are at all unsure. We are not under any obligation to update any such material. Any opinion made may be personal to the author and may not reflect the opinion of StoneX Europe Ltd.