



DJI outlook: Getting down with the Dow
Today we look at the Dow Jones which has seen momentum turn swiftly lower, in line with appetite for risk.
Share this:

It seems the days of simply buying the dip and hoping for the best are ‘long’ gone, with rallies petering out and reversing as market oscillate within weird and wonderful ranges. Whilst this is less than ideal for trend traders of higher timeframes, it can provide swing trading opportunities in both directions for bulls and bears. Today we look at the Dow Jones which has seen momentum turn swiftly lower, in line with appetite for risk.
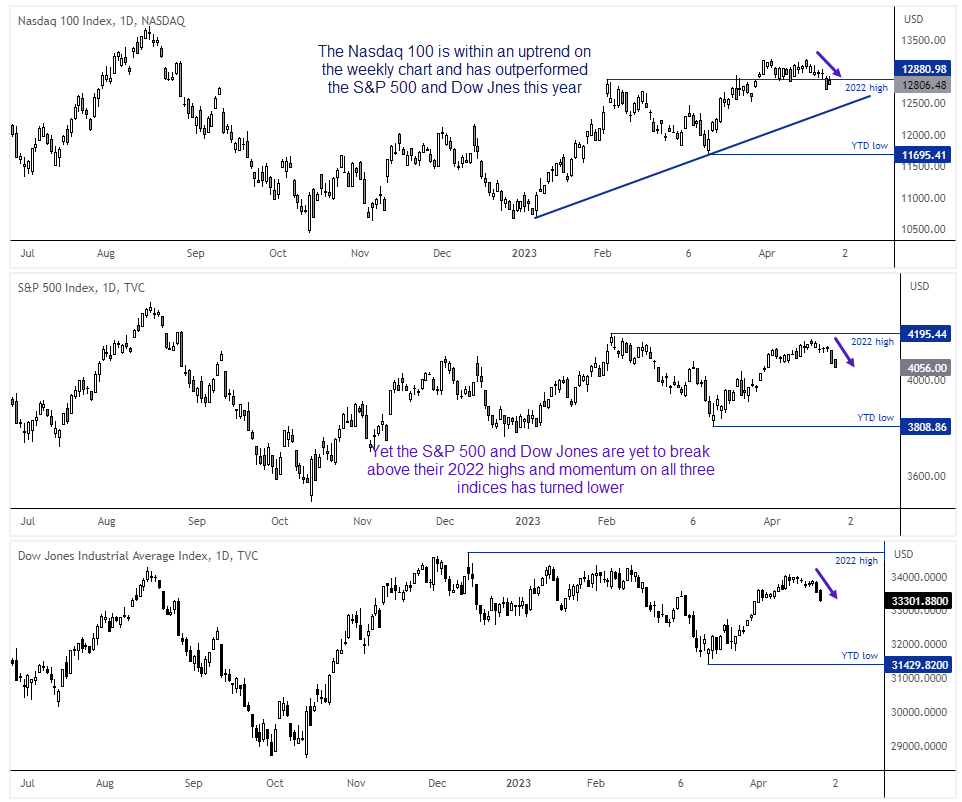
US indices YTD returns:
- Nasdaq 100: 16%
- S&P 100: 8.7%
- S&P 500: 6.5%
- Dow Jones: 0.5%
- Russell 2000: -2.2%
Tech stocks have been the clear winner so far in 2023, thanks in part to a weaker US dollar, bets that the Fed are approaching their terminal rate and that they could potentially cut rates this year. Yet as this earnings season has so far highlighted, tech stocks are not a good representation of the broader market with around half of the S&P 500 companies trading lower for the year. Furthermore, mega-cap stocks such as NVIDIA and Meta have supported the broader index with 84.5% and 74% rallies YTD respectively. Therefore, to bet on a broader market upswing is to bet that underperforming stocks can rally higher whilst the love of tech stocks remains in place. That doesn’t look particularly likely over the near-term.
Momentum turns lower on Wall Street indices:
A look at the weekly charts of the three major Wall Street indices reveals a couple of points. The Nasdaq has carved out a bullish trend this year and broken above its 2022 highs, which is something the S&P 500 and Dow Jones has failed to do. And with momentum pointing lower for all three indices, the Nasdaq is now back beneath its 2022 high. Perhaps its bullish trend will remain intact and prices will now retrace towards trend support, which could provide bears with short opportunities over the near-term.
But we would prefer to short the underperformers during downturns (such as the Dow or S&P 500) before seeking bullish opportunities on the outperformer (the Nasdaq 100) should momentum turn higher for all three indices.
As the Dow has been the weaker performer this year, remains beneath its December low and has made the weakest attempt to test the 2022 high, we prefer short opportunities on the Dow.
Dow Jones (DJI) daily chart:
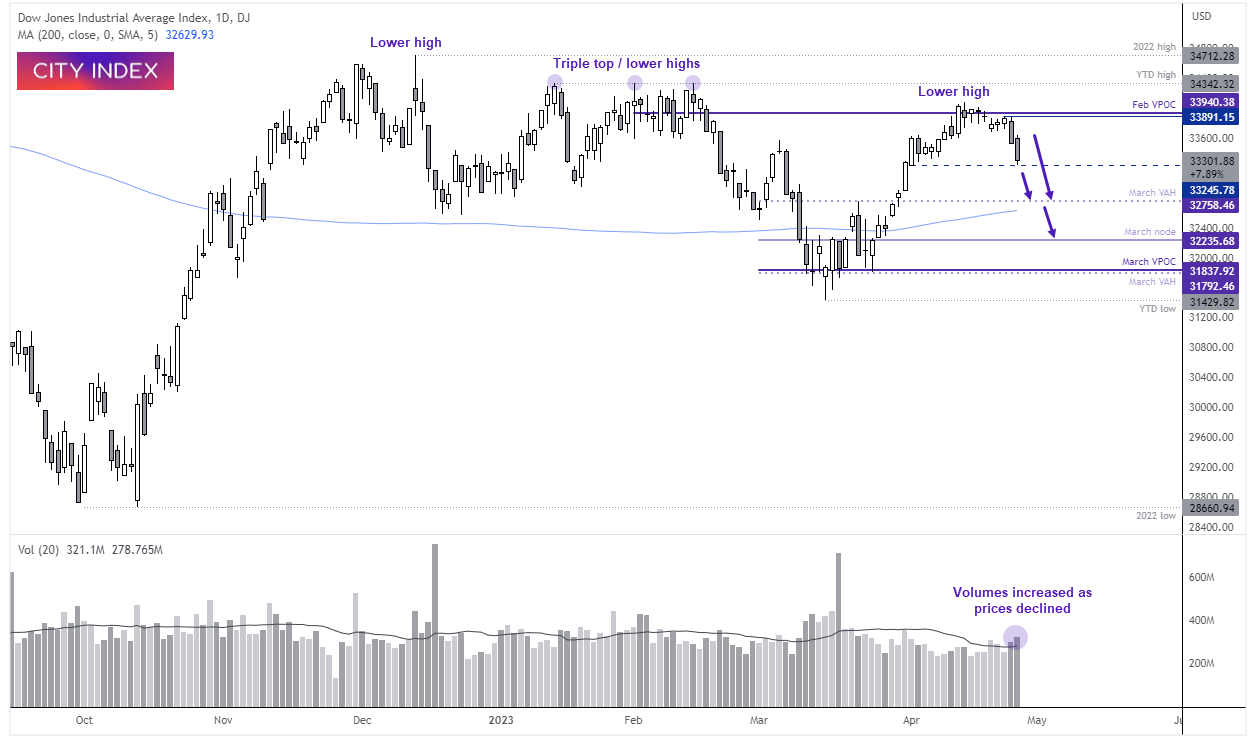
The Dow produced a prominent rally in October before topping out in December – a level it has struggled to retest since. January and February provided very choppy trading conditions and a triple top around 34,300. And despite an 8.5% from the March low, it has struggled to retest those highs. Also note that the recent rally petered out around the February VPOC (volume point of control) and daily trading volumes are increasing with falling prices, as bears step into the market. Ultimately, each rally produces a lower high and choppy trade as the market lacks the ambition to follow the Nasdaq higher.
- The bias remains bearish below 33900 and for a move down to 32,370
- We’d consider fading into rallies within the range of the past two days (which could help increase the potential reward to risk ratio)
- A break below 33,000 brings the 33,2758 high into focus (near the March VAH – value area high) and 200-day MA
- Should we see widespread risk-off across global markets, we could then consider lower targets around 33,265, 31,837-32,000 (March VPOC) and YTD low
-- Written by Matt Simpson
Follow Matt on Twitter @cLeverEdge
How to trade with City Index
You can trade with City Index by following these four easy steps:
- Open an account, or log in if you’re already a customer
• Open an account in the UK
• Open an account in Australia
• Open an account in Singapore
- Search for the market you want to trade in our award-winning platform
- Choose your position and size, and your stop and limit levels
- Place the trade
Related tags:



The complete CFD trading experience
Award-winning platforms, competitive spreads, low commissions and dedicated support.
We live and breathe the markets and are dedicated to helping traders realise their ambitions as we continue to set the industry bar.
Economic calendar
Web Trader platform
Our sophisticated web-based platform is packed with features.
Related articles

USD/JPY Weekly Outlook: Volatility Has Left the Building
The yen has ignored broad dollar weakness, falling Treasury yields and renewed market turbulence. Yet its relationship with US interest rates remains intact. So why is USD/JPY going absolutely nowhere fast?


Magnificent Seven Earnings Preview: Is the AI Boom Facing Its Biggest Test Yet?
After a wobble in the broader AI trade, the Magnificent Seven" stocks are reporting earnings in the coming week - see the key themes and Nasdaq 100 levels to watch!


Nasdaq 100 forecast: Tech stocks not out of woods yet
US index futures pushed higher in the first half of Friday’s session, taking cues from a strong performance from European equities. Both European and US equity futures extending yesterday’s impressive recovery after the sharp sell-off earlier in the week. But the lingering concerns around the AI investment cycle remain, while bond markets were easing lower again, lifting yields.

StoneX Europe Ltd may make third party material available on this website which may contain information included but not limited to the conditions of financial markets. The material is for information purposes only and does not contain, and should not be construed as containing, investment advice and/or investment recommendation and/or an investment research and/or an offer of or solicitation for any transactions in financial instruments; any decision to enter into a specific transaction shall be made by the client following an assessment by him/her of their situation.
StoneX Europe Ltd makes no representation or warranty and assumes no liability as to the accuracy or completeness of the information provided, nor any loss arising from any investment based on a recommendation, forecast or other information supplied. You should always seek independent advice as to your suitability to speculate in any related markets and your ability to assume the associated risks, if you are at all unsure. We are not under any obligation to update any such material. Any opinion made may be personal to the author and may not reflect the opinion of StoneX Europe Ltd.