




DJIA Forecast: The Dow Declines After the NFP
The Dow has managed to surpass the 44,000-point barrier and currently maintains steady growth of just over 7% since November.
Share this:

DJIA Forecast: The Dow Declines After the NFP
- The 44,000-point barrier has been surpassed in the short term; however, movements have remained neutral in this zone.
- The Dow lost points after the publication of the NFP, which registered 227k.
- The CME indicates a probability of over 85% for a FED interest rate reduction, an event that could create upward pressure on the Dow Jones in the short term.
The Dow has managed to surpass the 44,000-point barrier and currently maintains steady growth of just over 7% since November. However, a recent slowdown in movements has been observed, with a drop of approximately 1% following the release of the NFP data last Friday.
The Employment Dilemma
The data published last Friday, December 6, shows that the trend of new jobs reflected in the NFP remains bullish. The previous figure was around 36k, while the current figure shows a significant increase, reaching 227k and even surpassing the forecast of 200k.
The published data could establish an important connection with the Federal Reserve, as the rapid increase in employment, combined with the holiday season, could lead to a rise in consumption in the United States in the coming weeks. This, in turn, could influence the FED's Board of Governors' short-term decisions, potentially adopting an aggressive approach to maintaining the interest rate. Consequently, the Dow Jones outlook could turn bearish following these events.
Latest NFP Data

Source: FX Street
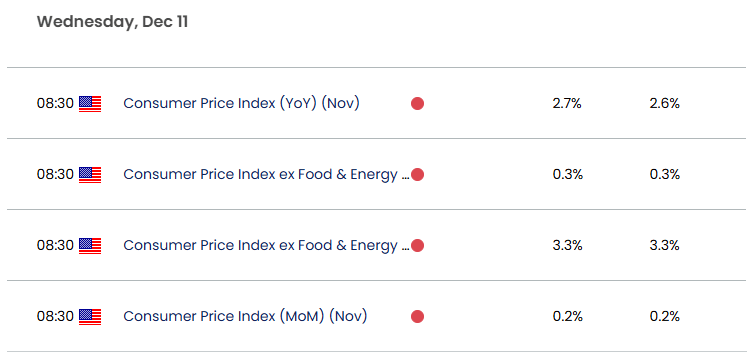
The annual Consumer Price Index (CPI) for the United States, to be published this Wednesday, is expected to stand at 2.7% year-over-year, slightly above the 2.6% recorded in November. An increase above expectations could negatively impact the outlook for the Dow Jones Industrial Average (DJIA), as investors may anticipate monetary policy adjustments from the Federal Reserve to control inflation. That said, the Central Bank might consider slowing the pace of interest rate reductions, which could influence consumer behavior and, consequently, affect the Dow Jones.
Inflation this week
Source: FX Street
What to Expect from the Next FED Decision
In recent days, FED Chair Jerome Powell has stated that the expectations for interest rate reductions are currently being met. However, there is no indication that this trend will accelerate in upcoming decisions.
Low interest rates are a key factor in maintaining confidence in equity index markets, which is a necessary step for indexes to sustain a strong upward trend in the long term.
FED Decision Probability Chart
Source: Cmegroup.com
According to the CME Group's probability chart, around 85% of current estimates suggest a rate cut to the 4.25%–4.5% range, while only about 14.2% predict that the rate will remain at its current level of 4.5%–4.75%. Thus, the Dow Jones is likely to remain in a neutral zone while investors prepare for the final decision on December 18. Since the rate cut is already anticipated, the market will focus on Powell's comments following the decision. If the approach aligns with previous decisions (allowing more room to lower interest rates), it is likely that the Dow will maintain its long-term upward trend. However, if the stance indicates steady interest rates for upcoming meetings, the Dow may face downward pressure as the market is expecting a series of rate reductions.
Dow Jones Technical Forecast
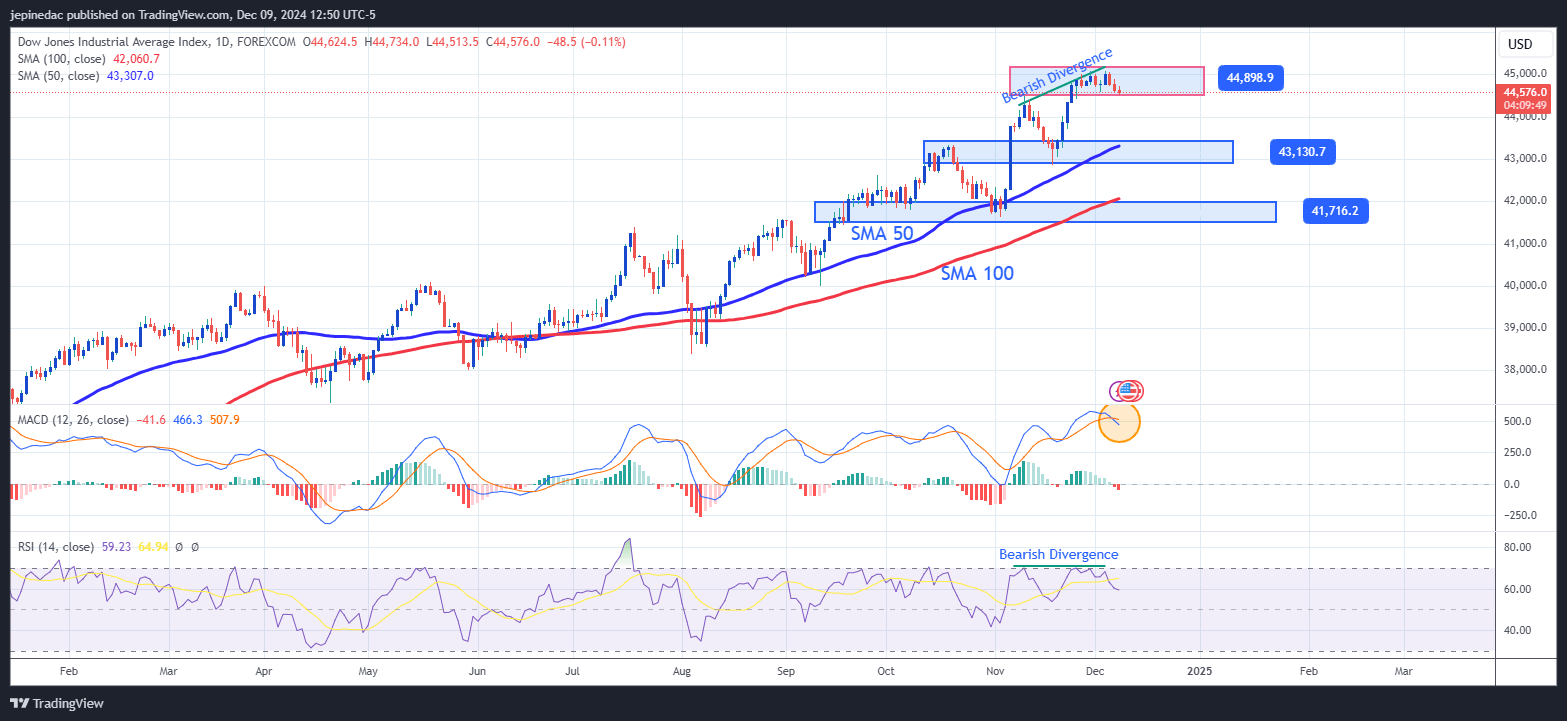
The Dow Jones Industrial Average (DJIA) has maintained a steady upward trend, recently reaching an all-time high of 45,000 points during the last five sessions. However, daily oscillations have remained around 0.6%, indicating a neutral stance among investors in the resistance zone of 44,000 points.
Source: Tradingview.com
- Steady Trend: Since August, the price of the DJIA began a stable upward trend near 38,000 points. Currently, the price has continued to rise, reaching the consolidation zone at 44,000 points. The simple moving averages of 50 and 100 daily periods consistently remain below price movements, indicating that, for now, no significant bearish correction threatens to break the current trend.
- Indicator Divergence: A Bearish divergence is currently observed between higher highs in price and steady highs in RSI levels, indicating that price acceleration is outpacing the momentum reflected by the indicators. This suggests a potential slowdown in bullish momentum, which could impact the trajectory of the current bullish trend.
Additionally, the MACD line is crossing below the Signal line, and the MACD histogram has started showing negative values, indicating that the bullish momentum from recent days has ended, creating room for bearish action. Both events could signal potential bearish corrections for the Dow Jones in the upcoming sessions.
- Key levels:
- 44k points: Current resistance zone on the chart; movements above this level could confirm bullish strength and the continuation of the current trend.
- 43,100 points: Closest support on the chart and a tentative zone for bearish correction oscillations.
- 41,700 points: Distant floor; oscillations at this level could jeopardize the bullish trend's strength and may even bring it to an end.
The inflation rate and the next Federal Reserve (FED) decision will be key factors in determining whether the Dow Jones Industrial Average (DJIA) can once again reach its all-time high of 45,000 points in the upcoming sessions.
Related tags:
Latest market news




The complete CFD trading experience
Award-winning platforms, competitive spreads, low commissions and dedicated support.
We live and breathe the markets and are dedicated to helping traders realise their ambitions as we continue to set the industry bar.
Economic calendar
Web Trader platform
Our sophisticated web-based platform is packed with features.
Related articles
S&P 500, Nasdaq, Dow Forecast: Wall Street Split Widens Into Month-End 9 26 2026
Nasdaq strength contrasts with mounting Dow pressure as rising Treasury yields raise the stakes for stocks heading into the monthly close.


Equity Indices Q4, 2026 Outlook: Cracks Begin to Show
There's still an open door for a melt-up in the S&P 500 and Nasdaq but the Dow and Russell 2000 are looking more vulnerable, and until calm hits the Treasuries market there's a higher probability for volatility. The big question is whether that's a next quarter theme or not.


USD/JPY Q4 2026 Outlook: Hawkish Fed Pricing Clashes With Intervention Risk
The year-end tug-of-war is clear: hawkish Fed pricing supports USD/JPY, while intervention risk limits the upside.

StoneX Europe Ltd may make third party material available on this website which may contain information included but not limited to the conditions of financial markets. The material is for information purposes only and does not contain, and should not be construed as containing, investment advice and/or investment recommendation and/or an investment research and/or an offer of or solicitation for any transactions in financial instruments; any decision to enter into a specific transaction shall be made by the client following an assessment by him/her of their situation.
StoneX Europe Ltd makes no representation or warranty and assumes no liability as to the accuracy or completeness of the information provided, nor any loss arising from any investment based on a recommendation, forecast or other information supplied. You should always seek independent advice as to your suitability to speculate in any related markets and your ability to assume the associated risks, if you are at all unsure. We are not under any obligation to update any such material. Any opinion made may be personal to the author and may not reflect the opinion of StoneX Europe Ltd.