






Hang Seng, China A50: IMF gets bullish as just as Chinese stocks roll over
It’s said the stock market isn’t the economy and based on the performance of Hang Seng futures on Wednesday, it’s hard to argue against. Because on the same day the International Monetary Fund upgraded its China economic growth forecast, stocks in Hong Kong are getting hammered.
Share this:

- IMF upgrades its Chinese economic growth forecasts for this year and next
- Fund is notorious for telling markets things they knew months ago
- Hang Seng futures generating multiple bearish signals
- China A50 futures at risk of breaking 2024 uptrend
It’s said the stock market isn’t the economy and based on the performance of Hang Seng futures on Wednesday, it’s hard to argue against. Because on the same day the International Monetary Fund upgraded its China economic growth forecast, stocks in Hong Kong are getting hammered.
IMF bullish on Chinese economic growth
The IMF revised up its 2024 and 2025 GDP forecasts by 0.4 percentage points to 5.0% and 4.5% respectively. However, it warned growth is likely slow to 3.3% by 2029 citing headwinds from aging demographics and weaker productivity growth. Gita Gopinath, the funds First Deputy Managing Director, said the upgrade was due to stronger-than-expected growth in the first quarter of the year, rising 5.3% from a year earlier.
Despite the optimistic assessment, the fund said risks remained to the downside, specifically mentioning the property market correction which Gopinath said “must continue” to put the economy on a more sustainable footing for the longer-term.
Just as Chinese stocks start rolling over
Rather than early and accurate in predicting shifts in the global economy, the IMF is a laggard when it comes to forecasts, often providing views that markets priced in months ago. It’s not unfair to describe the fund as something of a contrarian indicator, a view bolstered by the reaction of stocks listed in Hong Kong which fell sharply in early trade on Wednesday, led by losses in tech, healthcare, financials of more than 1.7%.
Hang Seng generating bearish signals
Looking at futures, the tombstone doji candle printed on Tuesday warned of growing downside risks. And in the absence of a decent bounce into the close, the three-candle pattern to start the week resembles an evening star, another indicator of a near-term top.
For the moment, Hang Seng futures are finding support at 18500, a level that’s been tested on four separate occasions over the past month, including today. With potential downtrend resistance nearby, a break of 18500 opens the door to a deeper flush, potentially to 18150 or 18000. Below, 17500 is the next level to watch with more pronounced support found at 17200.
Should 18500 give way, consider selling the break with a stop loss order above for protection. Alternatively, should 18500 hold and futures push through the downtrend, consider buying with a stop below the level for protection. 18960 would be the initial trade target. Given RSI and MACD show momentum is building the downside, selling rallies and breaks is preferred to buying dips.
China A50 bears eye uptrend test
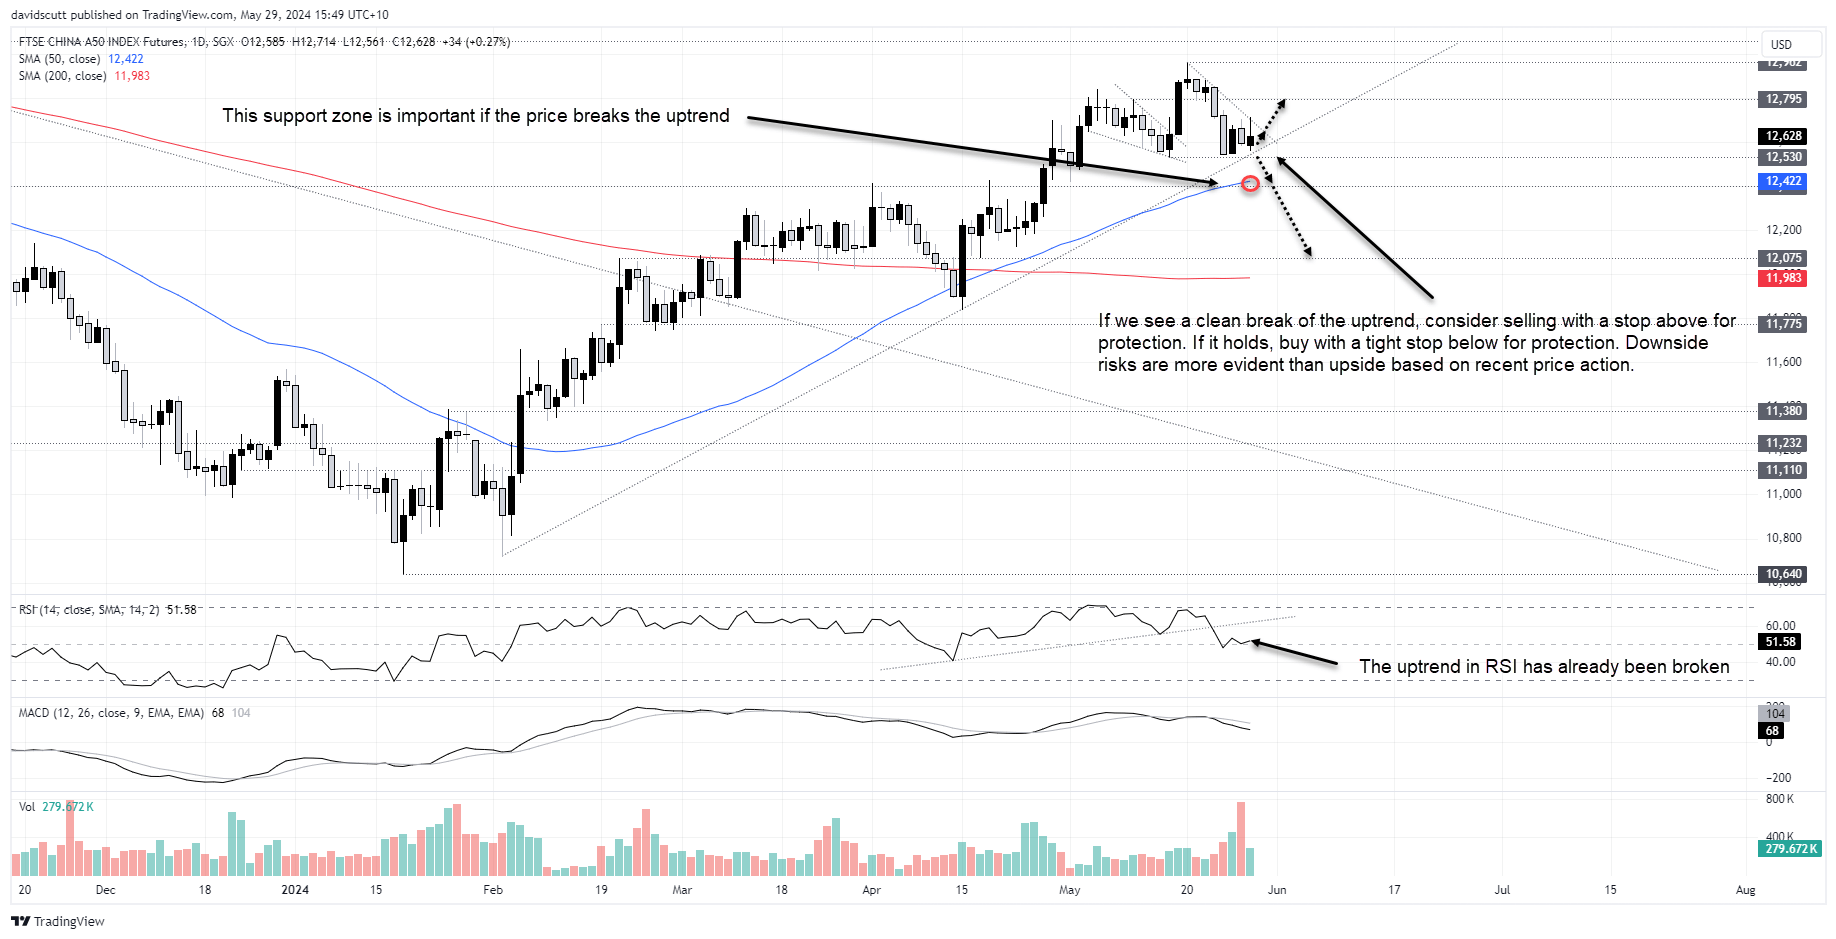
While the Hang Seng is looking worse for ware, stocks listed in the mainland are faring slightly better with China A50 futures managing to hold in positive territory. However, sitting in a minor downtrend and bumping up against a longer-running uptrend, you get the sense that the next couple of days could be influential in determining its longer-run trajectory.
It comes with the caveat that candle is yet to be complete, but the long topside wick of Wednesday's daily candle, combined with building downside momentum in indicators such as MACD and RSI, suggests we may soon see a test of the downtrend dating back to early February. Should it go, 12530, 12422, 12400 and 12075 are the downside targets to watch. 12422 is the current location of the 50-day moving average, a level A50 futures have respected on multiple occasions over recent years. Combined with horizontal support at 12400, that’s an important zone for bears to watch.
If we see a clean break, consider selling with a stop loss above the former trendline for protection. On the flipside, if the uptrend holds, another trade idea would be to buy with a stop below the level for protection. As is the case with the Hang Seng, selling rallies or breaks is preferred to buying dips in the near-term.
-- Written by David Scutt
Follow David on Twitter @scutty
How to trade with City Index
You can trade with City Index by following these four easy steps:
- Open an account, or log in if you’re already a customer
• Open an account in the UK
• Open an account in Australia
• Open an account in Singapore
- Search for the market you want to trade in our award-winning platform
- Choose your position and size, and your stop and limit levels
- Place the trade
Related tags:


The complete CFD trading experience
Award-winning platforms, competitive spreads, low commissions and dedicated support.
We live and breathe the markets and are dedicated to helping traders realise their ambitions as we continue to set the industry bar.
Economic calendar
Web Trader platform
Our sophisticated web-based platform is packed with features.
Related articles

USD/CAD forecast: rally could accelerate above June highs at 1.4250
USD/CAD recovered quickly after weaker US jobs data, keeping the bullish trend in focus. A move above the June highs could accelerate the rally as inflation keeps the Fed under pressure.


Dow Jones Slide Shows What Rate Hike Bets Mean for Stocks
The Dow Jones support breakdown shows rising bond yields and rate hike bets hitting U.S. stocks while tech giants prop up the Nasdaq.

EUR/USD forecast remains tilted lower with French bond troubles ahead of US jobs report
The EUR/USD has tagged a fresh year-to-date low as French public-finance concerns trigger a government bond sell-off. Today's US jobs report may change little, with resilient activity, elevated energy prices and hawkish Fed bets keeping the greenback supported. With the pair trapped below resistance at 1.1410, the risk to the near-term EUR/USD forecast is tilted to the downside.
StoneX Europe Ltd may make third party material available on this website which may contain information included but not limited to the conditions of financial markets. The material is for information purposes only and does not contain, and should not be construed as containing, investment advice and/or investment recommendation and/or an investment research and/or an offer of or solicitation for any transactions in financial instruments; any decision to enter into a specific transaction shall be made by the client following an assessment by him/her of their situation.
StoneX Europe Ltd makes no representation or warranty and assumes no liability as to the accuracy or completeness of the information provided, nor any loss arising from any investment based on a recommendation, forecast or other information supplied. You should always seek independent advice as to your suitability to speculate in any related markets and your ability to assume the associated risks, if you are at all unsure. We are not under any obligation to update any such material. Any opinion made may be personal to the author and may not reflect the opinion of StoneX Europe Ltd.