






Is China in a Recovery
Watch for USD/CNH to break higher out of the pennant
Share this:

In a few hours, China will release their “Official” NBS Manufacturing PMI data for March. The expectation is for a reading of 45, which is still in contraction territory. However, a print of 45 is much better than the previous reading of 35.7. (A reading above 50 means the economy is in expansion and a reading below 50 means the economy is on contraction.) In addition, the “Official” Non-Manufacturing PMI for March is also going to be released. There is not an estimate for this figure, however the previous reading was 29.6. The reason I say “Official” is because this data is put out by the Chinese government. Depending on who you ask, these readings may or may not be accurate as they could be. The more accurate data may come on Thursday, when the private company Caixin Global puts out their survey reading. Ironically, Caixin is expecting a reading of 45.8, slightly better than expectation on of the “Official” reading. Regardless, with cononavirus cases falling in China, and with factories and stores reopening, the number is likely to be better than last months!
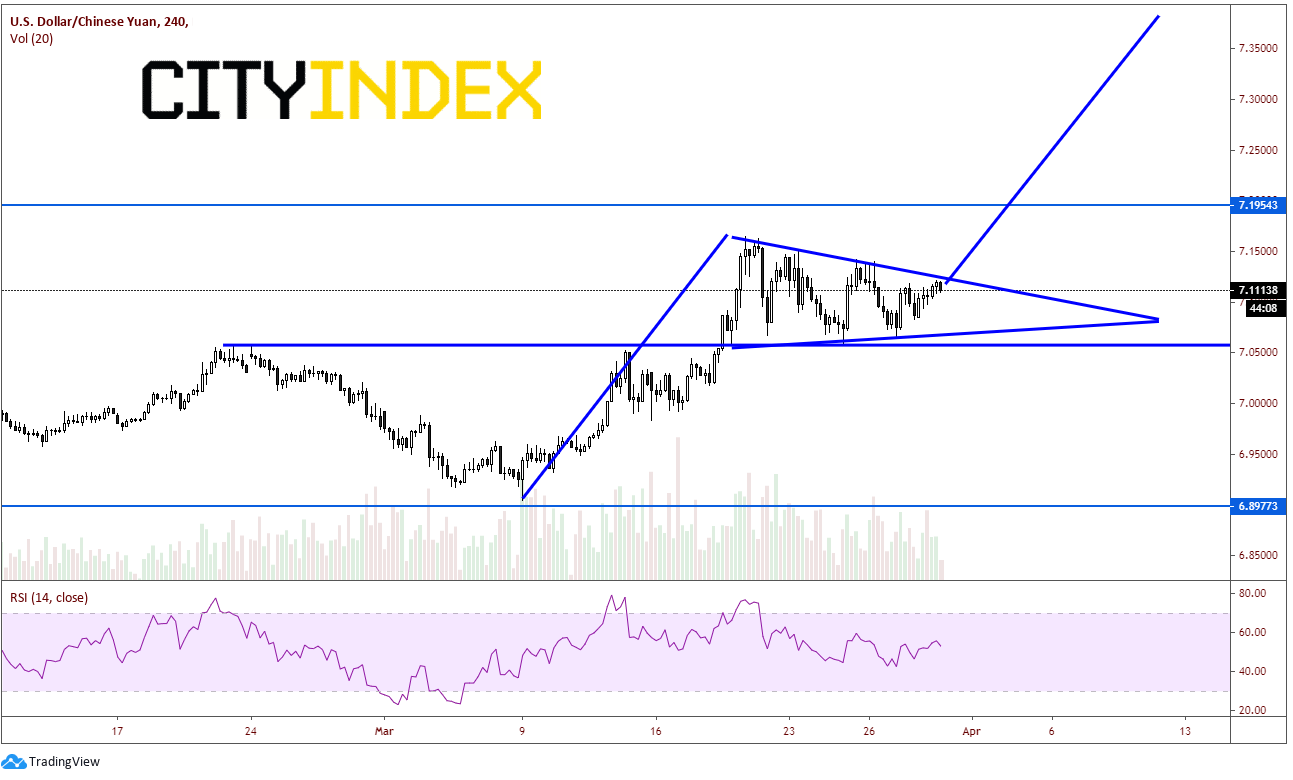
If the data is worse than expected, the US Dollar may continue to advance vs the Chinese Yuan. The USD/CNH had put in a high of 7.1959 on September 3, 2019 and began forming a sideways channel, hitting a low 0f 6.8456 on January 20th. After breaking out of a descending wedge (and retesting the bottom of the channel on March 9th), the pair shot higher back towards the top of the channel and is currently consolidating in a pennant formation. Price consolidations in a pennant formation usually break out is the same direction of the previous move. Therefore, we should look for a breakout higher. Notice that as price reached the high of the pennant, the RSI was in overbought territory. This consolidation allowed for the RSI to move back within the neutral zone.
Source: Tradingview, City Index
On a 240- minute time frame we can get a better sense of support and resistance levels. First resistance is at today’s highs and the downward sloping trendline from the pennant near 7.1300. Above there is the near term high and top of the pennant at 7.1650. Finally, the all-time high from September is the third resistance level at 7.1854. First support is the upward sloping trendline from the bottom of the pennant near 7.07. Not far below that is the next level of horizontal support near 7.0571. Below there is the third level of support near the channel bottom at 6.9200.
Source: Tradingview, City Index
Whether or not the “Official” Manufacturing PMI and Non-Manufacturing PMI readings are real or not, the Caixin figures will matter more. And given the price formation at the moment, watch for USD/CNH to break higher out of the pennant (and note the target is way above near 7.38!).
In a few hours, China will release their “Official” NBS Manufacturing PMI data for March. The expectation is for a reading of 45, which is still in contraction territory. However, a print of 45 is much better than the previous reading of 35.7. (A reading above 50 means the economy is in expansion and a reading below 50 means the economy is on contraction.) In addition, the “Official” Non-Manufacturing PMI for March is also going to be released. There is not an estimate for this figure, however the previous reading was 29.6. The reason I say “Official” is because this data is put out by the Chinese government. Depending on who you ask, these readings may or may not be accurate as they could be. The more accurate data may come on Thursday, when the private company Caixin Global puts out their survey reading. Ironically, Caixin is expecting a reading of 45.8, slightly better than expectation on of the “Official” reading. Regardless, with cononavirus cases falling in China, and with factories and stores reopening, the number is likely to be better than last months!
If the data is worse than expected, the US Dollar may continue to advance vs the Chinese Yuan. The USD/CNH had put in a high of 7.1959 on September 3, 2019 and began forming a sideways channel, hitting a low 0f 6.8456 on January 20th. After breaking out of a descending wedge (and retesting the bottom of the channel on March 9th), the pair shot higher back towards the top of the channel and is currently consolidating in a pennant formation. Price consolidations in a pennant formation usually break out is the same direction of the previous move. Therefore, we should look for a breakout higher. Notice that as price reached the high of the pennant, the RSI was in overbought territory. This consolidation allowed for the RSI to move back within the neutral zone.
Source: Tradingview, FOREX.com
On a 240- minute time frame we can get a better sense of support and resistance levels. First resistance is at today’s highs and the downward sloping trendline from the pennant near 7.1300. Above there is the near term high and top of the pennant at 7.1650. Finally, the all-time high from September is the third resistance level at 7.1854. First support is the upward sloping trendline from the bottom of the pennant near 7.07. Not far below that is the next level of horizontal support near 7.0571. Below there is the third level of support near the channel bottom at 6.9200.
Source: Tradingview, FOREX.com
Whether or not the “Official” Manufacturing PMI and Non-Manufacturing PMI readings are real or not, the Caixin figures will matter more. And given the price formation at the moment, watch for USD/CNH to break higher out of the pennant (and note the target is way above near 7.38!).
Latest market news




The complete CFD trading experience
Award-winning platforms, competitive spreads, low commissions and dedicated support.
We live and breathe the markets and are dedicated to helping traders realise their ambitions as we continue to set the industry bar.
Economic calendar
Web Trader platform
Our sophisticated web-based platform is packed with features.
Related articles
Canadian Dollar Analysis: USD/CAD Returns to July Highs Ahead of NFP
The Canadian dollar continues to face one of its most challenging environments in recent months when it comes to maintaining strength against the U.S. dollar. The weakness of the Canadian currency is clearly reflected in USD/CAD, which has now recorded nine consecutive bullish sessions and gained more than 1.7% during that period.
US Dollar Technical Outlook: DXY Bulls Meet Resistance at Yearly Highs 10 1 2026
The U.S. Dollar has held firm despite fading Fed hike bets, but Friday’s payrolls could test the rally’s staying power.


AUD/USD hammered by US yields and fading RBA hike bets
US yields, dollar strength and fading RBA hike bets have combined to drive AUD/USD to fresh multi-month lows. The macro and technical bias remains bearish, although history suggests parts of the move are now reaching unusually stretched levels.

StoneX Europe Ltd may make third party material available on this website which may contain information included but not limited to the conditions of financial markets. The material is for information purposes only and does not contain, and should not be construed as containing, investment advice and/or investment recommendation and/or an investment research and/or an offer of or solicitation for any transactions in financial instruments; any decision to enter into a specific transaction shall be made by the client following an assessment by him/her of their situation.
StoneX Europe Ltd makes no representation or warranty and assumes no liability as to the accuracy or completeness of the information provided, nor any loss arising from any investment based on a recommendation, forecast or other information supplied. You should always seek independent advice as to your suitability to speculate in any related markets and your ability to assume the associated risks, if you are at all unsure. We are not under any obligation to update any such material. Any opinion made may be personal to the author and may not reflect the opinion of StoneX Europe Ltd.