



Japanese Yen Outlook: USD/JPY Meets 200-Day SMA, AUD/JPY Hints at Swing High
USD/JPY stalls at its 200-day SMA as bullish momentum fades, while AUD/JPY hints at a swing high. Japanese yen reversal risks are building.
Share this:

The US dollar remains supported by elevated Treasury yields and expectations of further Fed tightening, yet USD/JPY is struggling to regain bullish momentum near its 200-day SMA. AUD/JPY is also showing signs of fatigue following a bearish outside day. With both yen crosses stalling near resistance, the potential for a Japanese yen rebound is growing, although a fresh catalyst may be needed to trigger a more convincing reversal.
View related analysis:
Japanese Yen Rebound Risks Build as USD/JPY and AUD/JPY Lose Momentum
US Dollar Supported by Hawkish Fed and Elevated Treasury Yields
The US dollar strengthened on Wednesday as renewed Iran tensions kept oil prices elevated and reinforced inflation concerns, helping drive Treasury yields higher. The move was also supported by euro weakness and expectations that the Fed may still need to tighten again this year.
The FOMC minutes showed that, while policymakers were unanimous in raising rates in September, there was less agreement over the timing of the next move. Officials including Williams and Jefferson have argued there is no need to rush, with markets now favouring December over October for another hike. The minutes therefore kept the Fed’s tightening bias intact without materially reviving near-term hike expectations.
The surge in Treasury yields briefly eased after a strong $39 billion 10-year auction attracted robust demand. The sale drew a 2.77 bid-to-cover ratio, with indirect bidders taking more than 80% of the issue, helping push the 10-year yield back from an earlier peak near 5.36%. While that removed some rate support for the US dollar, yields remained historically elevated and continued to underpin the broader USD rally.
US Dollar Strength Weighs on FX, Commodities and Equities
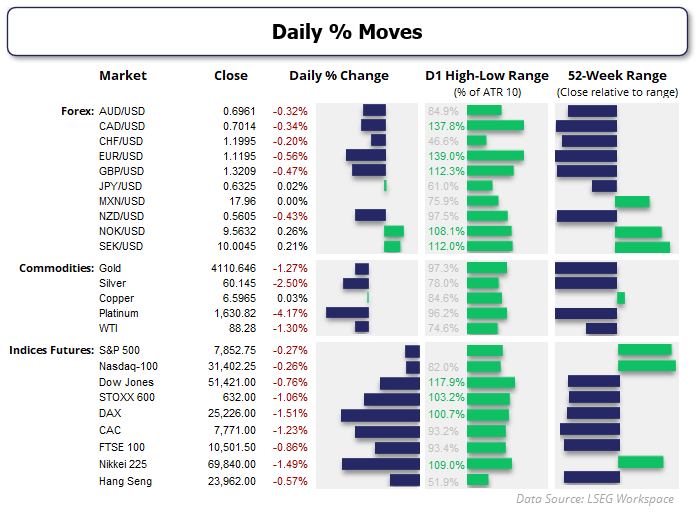
- US Dollar: Broadly stronger as hawkish Fed expectations and elevated Treasury yields weigh on FX majors. GBP/USD (-0.47%) and EUR/USD (-0.56%) lead declines.
- Japanese Yen: USD/JPY holds broadly flat (+0.02%), outperforming most dollar pairs as yen demand remains resilient.
- Commodities: Gold (-1.27%) and silver (-2.50%) retreat amid USD strength, while WTI crude (-1.30%) also weakens.
- Equity Indices: European stocks lead losses, with the DAX (-1.51%) and CAC 40 (-1.23%) underperforming. Wall Street futures slip around 0.3%.
- Risk Sentiment: Nikkei 225 (-1.49%) and broad European weakness point to a cautious tone, despite relatively modest losses in US futures.

USD/JPY Technical Analysis: US Dollar vs Japanese Yen
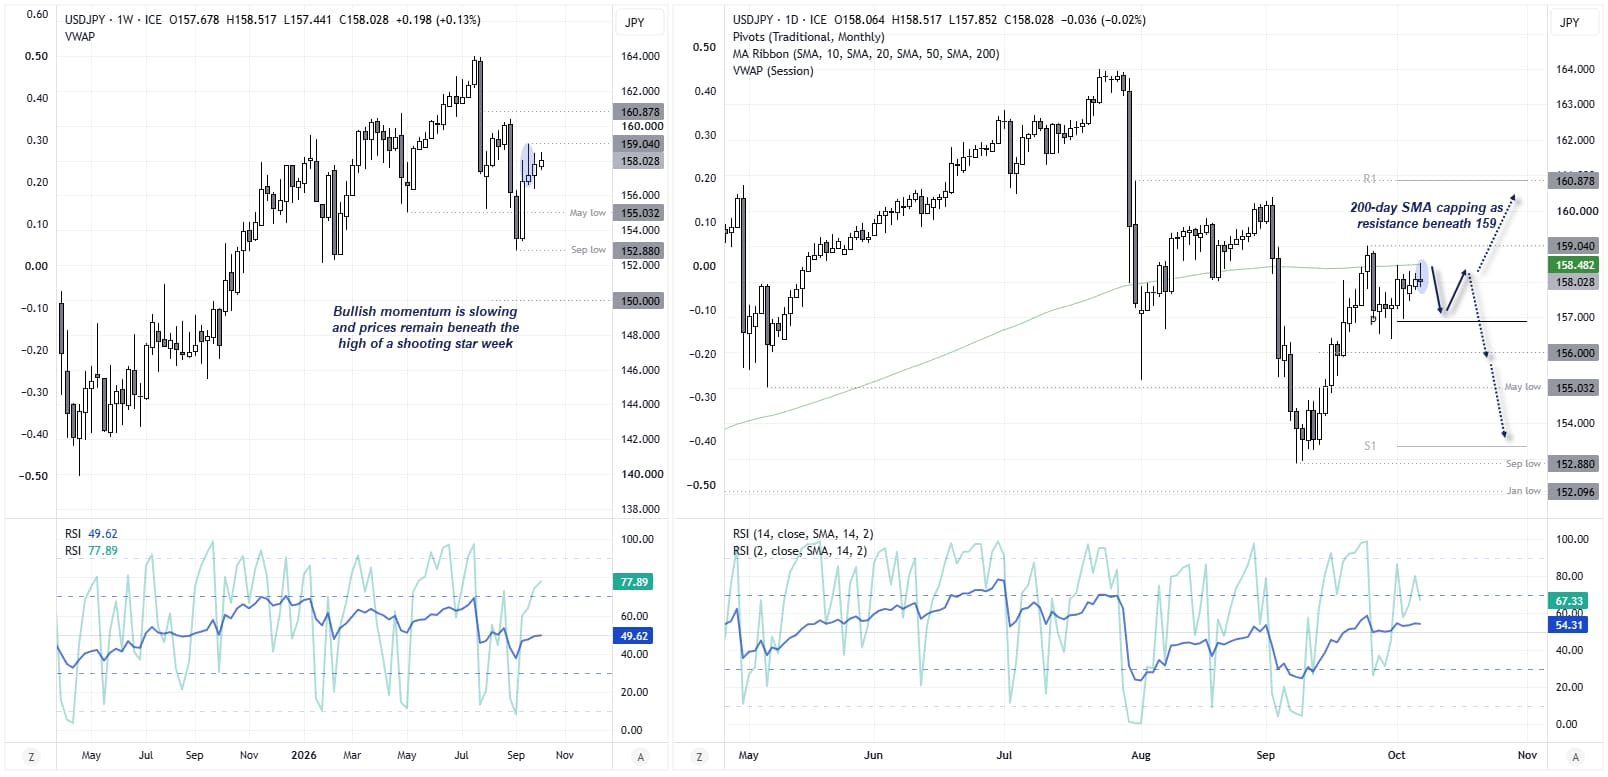
We’re at a slight stalemate between the BOJ and Fed, with traders having scaled back bets on both central banks delivering more aggressive rate hikes. That has reduced volatility in USD/JPY for now, though that is not to say it cannot return. What has caught my eye is that Wednesday’s high met resistance at the 200-day SMA, forming a small bearish pinbar.
While we obviously need a catalyst to see momentum roll over from here, the fact that USD/JPY is struggling to retest the 159.04 high is at least an indication that bulls are losing steam. Bullish momentum has faded, and price action is now choppy beneath a swing high – which, to me, are clues of a potential inflection point. Now we just need the catalyst.
Source: ICE, TradingView
AUD/JPY Technical Analysis: Australian Dollar vs Japanese Yen
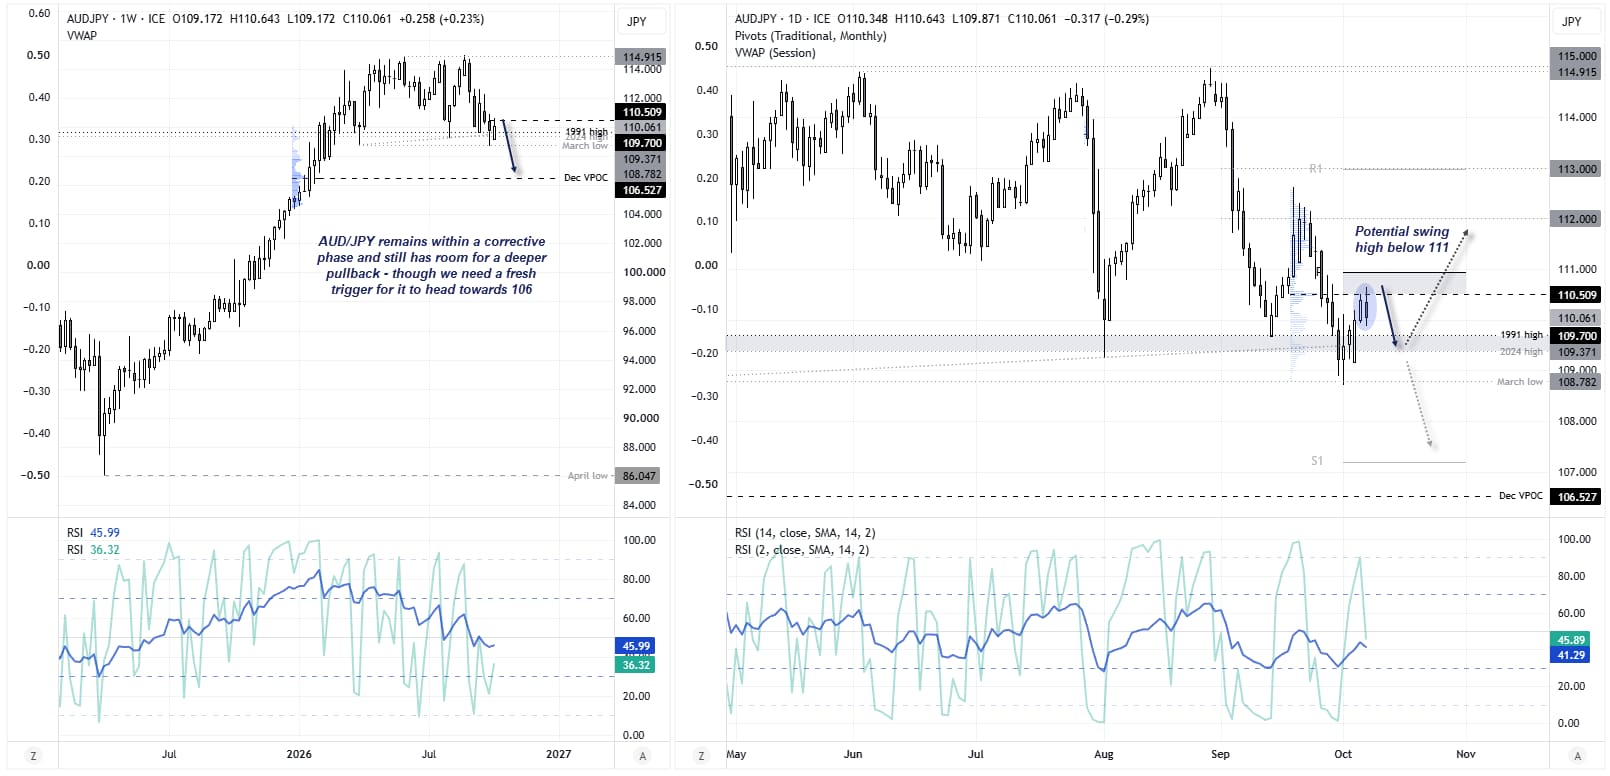
It remains up for debate whether we’re about to witness a sharp break lower as part of a multi-month topping pattern, or see AUD/JPY recycle higher towards 112 before the real selloff begins.
The weekly AUD/JPY chart shows that the strong uptrend between April 2025 and 2026 is still within its corrective phase. Even a move down to 106 – near its December VPOC – could still be deemed an orderly pullback for the Australian dollar against the Japanese yen in the grand scheme of things.
Pullback Risks Rise as Bears Eye 111 Resistance
But perhaps we could be in for a minor pullback over the near term, given that a four-day rally was broken on Wednesday with a bearish outside day. Note that yesterday’s high stalled around a high-volume node (HVN) of the recent decline, and the monthly pivot point is nearby, just beneath 111. Bears could seek to fade minor rallies while AUD/JPY remains beneath the 111 area.
Though a strong selloff would likely require intervention by Japan’s Ministry of Finance (MOF), a broad risk-off tone – or both combined.
Note the potential support levels around the 1991 high (109.7), 2024 high (109.37) and March low (108.78).
Source: ICE, TradingView
Related tags:
Latest market news




The complete CFD trading experience
Award-winning platforms, competitive spreads, low commissions and dedicated support.
We live and breathe the markets and are dedicated to helping traders realise their ambitions as we continue to set the industry bar.
Economic calendar
Web Trader platform
Our sophisticated web-based platform is packed with features.
Related articles
Silver's bullish breakout case builds as bond yields retreat
The Democratic blue wave has sent crude and Treasury yields sharply lower, improving the outlook for precious metals. With gold already breaking higher, could silver be next?
Swiss Franc Short-term Outlook: USD/CHF Selloff Nears Critical Support Ahead of NFP 11 4 2026
USD/CHF bears are closing in on critical trend support, with the next reaction likely to determine whether the October decline has further to run.

USD/CAD Forecast: Canadian Dollar Gains Ground After U.S. Midterm Elections
The trading week continues to unfold and the recovery in the Canadian dollar has once again become a relevant theme in the short term. This can be clearly seen in the recent performance of USD/CAD, which is down nearly 0.4% during the session, reflecting a consistent recovery in the CAD against the U.S. dollar.

StoneX Europe Ltd may make third party material available on this website which may contain information included but not limited to the conditions of financial markets. The material is for information purposes only and does not contain, and should not be construed as containing, investment advice and/or investment recommendation and/or an investment research and/or an offer of or solicitation for any transactions in financial instruments; any decision to enter into a specific transaction shall be made by the client following an assessment by him/her of their situation.
StoneX Europe Ltd makes no representation or warranty and assumes no liability as to the accuracy or completeness of the information provided, nor any loss arising from any investment based on a recommendation, forecast or other information supplied. You should always seek independent advice as to your suitability to speculate in any related markets and your ability to assume the associated risks, if you are at all unsure. We are not under any obligation to update any such material. Any opinion made may be personal to the author and may not reflect the opinion of StoneX Europe Ltd.