




Japanese Yen Technical Analysis: USD/JPY, EUR/JPY, GBP/JPY
USD/JPY started the week with a strong breakout but that’s snapped back over the past three days, bringing with it questions around the trend in JPY.
Share this:

Japanese Yen, USD/JPY Talking Points:
- After a strong breakout to start the week, bears have been clawing back in USD/JPY and the weekly bar is currently showing as a gravestone doji.
- For Yen-strength, EUR/JPY can remain a more attractive venue and for Yen-weakness, GBP/JPY a more amenable backdrop.
- I’ll be looking into all three markets in tomorrow’s webinar and you’re welcome to join. Click here to register.
USD/JPY made a large move on Monday to start the week and since then it’s been mostly clawing back by bears. This takes place at a big spot on the weekly chart as the same trendline that’s held the highs for the past two weeks – which was also leading into a bounce on Wednesday – remains in-play as we push into Friday trade.
All hope is not lost for bulls at this point as it’s the 145 level that looms large. This was resistance-turned-support over the past two weeks and that remains an item of interest as we wind towards the end of the week.
If we do see sellers continue the late-week move to finish the weekly bar in the red, this will take on the form of a shooting star after a failed breakout at 148.00. But, if looking for Yen-strength, there may be a more attractive setup elsewhere which I’ll look at in a moment.
USD/JPY Weekly Chart
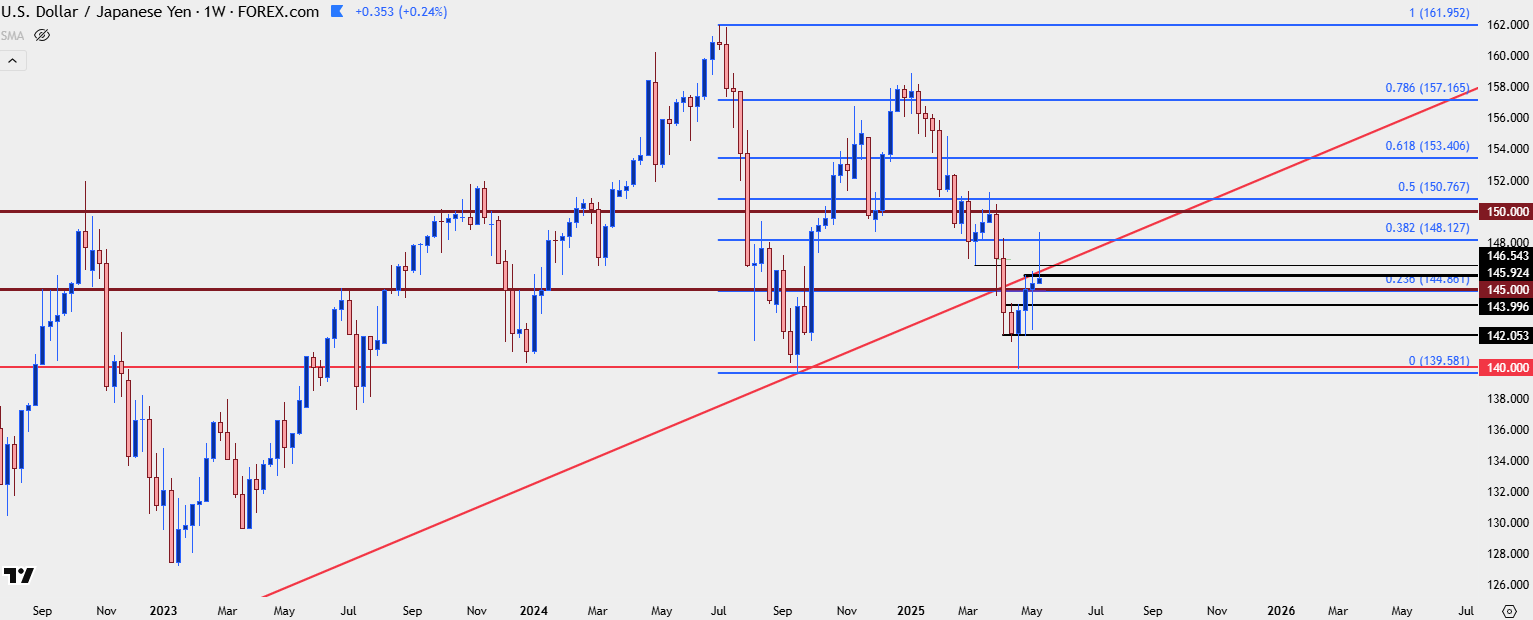 Chart prepared by James Stanley; data derived from Tradingview
USD/JPY Daily
Despite the three-day sell-off an argument can still be made of higher-highs and lows, and that’s largely because of last week’s support hold at 145.00 on Friday. This sets up that price as a contentious spot into the end of this week, as sellers closing the weekly candle below that not only shows a break of the higher-highs and lows sequence, but a weekly shooting star formation as noted above.
USD/JPY Daily Price Chart
 Chart prepared by James Stanley; data derived from Tradingview
EUR/JPY
If looking for Yen-strength, I’m still partial towards EUR/JPY and this week is showing yet another failure from bulls at the 163.00-163.38 resistance zone.
The week started with Yen-weakness here, as well, but while USD/JPY is still showing a green weekly bar (as is GBP/JPY, as of this writing), EUR/JPY has already pushed into red territory for the week with what looks like both a bearish pin bar and a shooting star formation.
Longer-term, there’s also a descending triangle formation in here, although support for that is all the way down around the 155.00 level, and we’re still within the confines of longer-term digestion so it would be a bit early to start speculating on a break of the broader formation. But – the 160.00 level held the lows in March and April and this remains a key spot if JPY-bulls continue to push.
EUR/JPY Weekly Price Chart
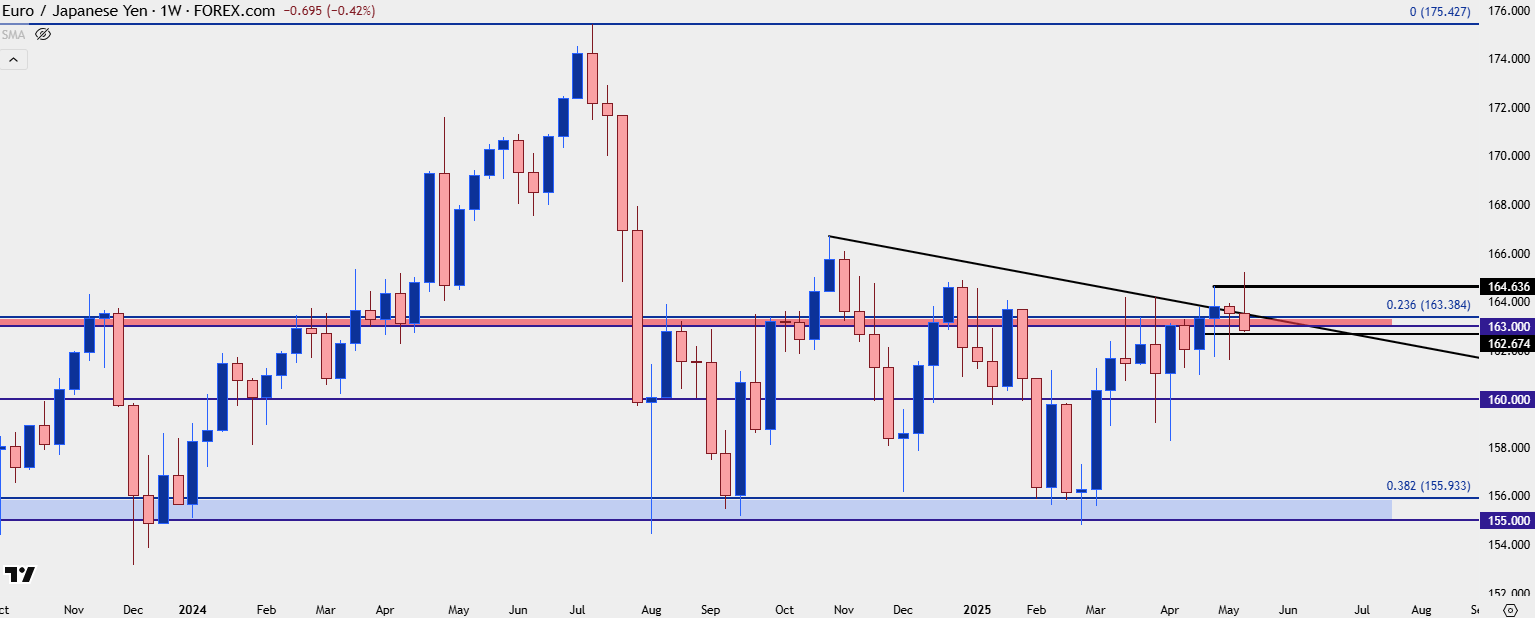 Chart prepared by James Stanley; data derived from Tradingview
GBP/JPY
For JPY-weakness, I think GBP/JPY still carries more attraction than USD/JPY, and at the present the pair is testing a major area on the chart. I’m going to have to start off with the monthly chart to explain.
GBP/JPY Monthly Chart
 Chart prepared by James Stanley; data derived from Tradingview
There was a sizable gap produced by the Financial Collapse back in 2008 in GBP/JPY that continues to carry some weight today. The month of August 2008 saw GBP/JPY close at 198.08, but then September opened almost 500 pips lower, at 193.61.
The bottom of that gap came into play as resistance in 2015, holding the highs over a three-month stretch until a reversal ultimately could take over. But more recently, this has been a constant force in GBP/JPY price action after showing as resistance last March. It remains a notable item of contention today, after having shown as resistance over the past two weeks and, from the weekly chart below, a possible third week of resistance, as well.
GBP/JPY Weekly Chart
 Chart prepared by James Stanley; data derived from Tradingview
GBP/JPY
The daily chart paints a slightly different picture as the upper wick on the weekly instead shows with more granularity, from two days of strength followed by two days of weakness; but, at this point, it’s also an illustration of possible support at prior resistance. There’s also more room for bulls to breathe, as last week’s swing low is all the way down around 190.31, setting the stage for support potential at prices such as 192.64 or perhaps even 191.67.
GBP/JPY Daily Chart
 Chart prepared by James Stanley; data derived from Tradingview
--- written by James Stanley, Senior Strategist
Related tags:
Latest market news




The complete CFD trading experience
Award-winning platforms, competitive spreads, low commissions and dedicated support.
We live and breathe the markets and are dedicated to helping traders realise their ambitions as we continue to set the industry bar.
Economic calendar
Web Trader platform
Our sophisticated web-based platform is packed with features.
Related articles

USDJPY Forecast Intervention Fears Clash with Dollar Strength
Recent trading sessions have produced mixed results for the Japanese yen. By the end of last week, USD/JPY had fallen by more than 1.00%, reflecting a modest recovery in the yen. However, the start of this week has seen the pair move slightly back in favor of the U.S. dollar, posting gains of around 0.04%.

USD/JPY Analysis: Is the Yen Still Weak Despite the BOJ Rate Hike?
The Japanese yen continues to face challenging conditions in the short term. By the end of the week, USD/JPY had gained nearly 2.00% over the previous five trading sessions, highlighting ongoing weakness in the yen and showing that the U.S. dollar continues to gain ground.
USD/JPY Analysis: Japan's Interventions Continue to Support Yen Strength
The yen has continued to gain relevance during recent trading sessions and, over the last four trading days, USD/JPY has declined by nearly 3.6%, highlighting the strength currently being displayed by the Japanese currency against the U.S. dollar.
StoneX Europe Ltd may make third party material available on this website which may contain information included but not limited to the conditions of financial markets. The material is for information purposes only and does not contain, and should not be construed as containing, investment advice and/or investment recommendation and/or an investment research and/or an offer of or solicitation for any transactions in financial instruments; any decision to enter into a specific transaction shall be made by the client following an assessment by him/her of their situation.
StoneX Europe Ltd makes no representation or warranty and assumes no liability as to the accuracy or completeness of the information provided, nor any loss arising from any investment based on a recommendation, forecast or other information supplied. You should always seek independent advice as to your suitability to speculate in any related markets and your ability to assume the associated risks, if you are at all unsure. We are not under any obligation to update any such material. Any opinion made may be personal to the author and may not reflect the opinion of StoneX Europe Ltd.