







Nasdaq 100 forecast: Nvidia hype meets rising yield reality
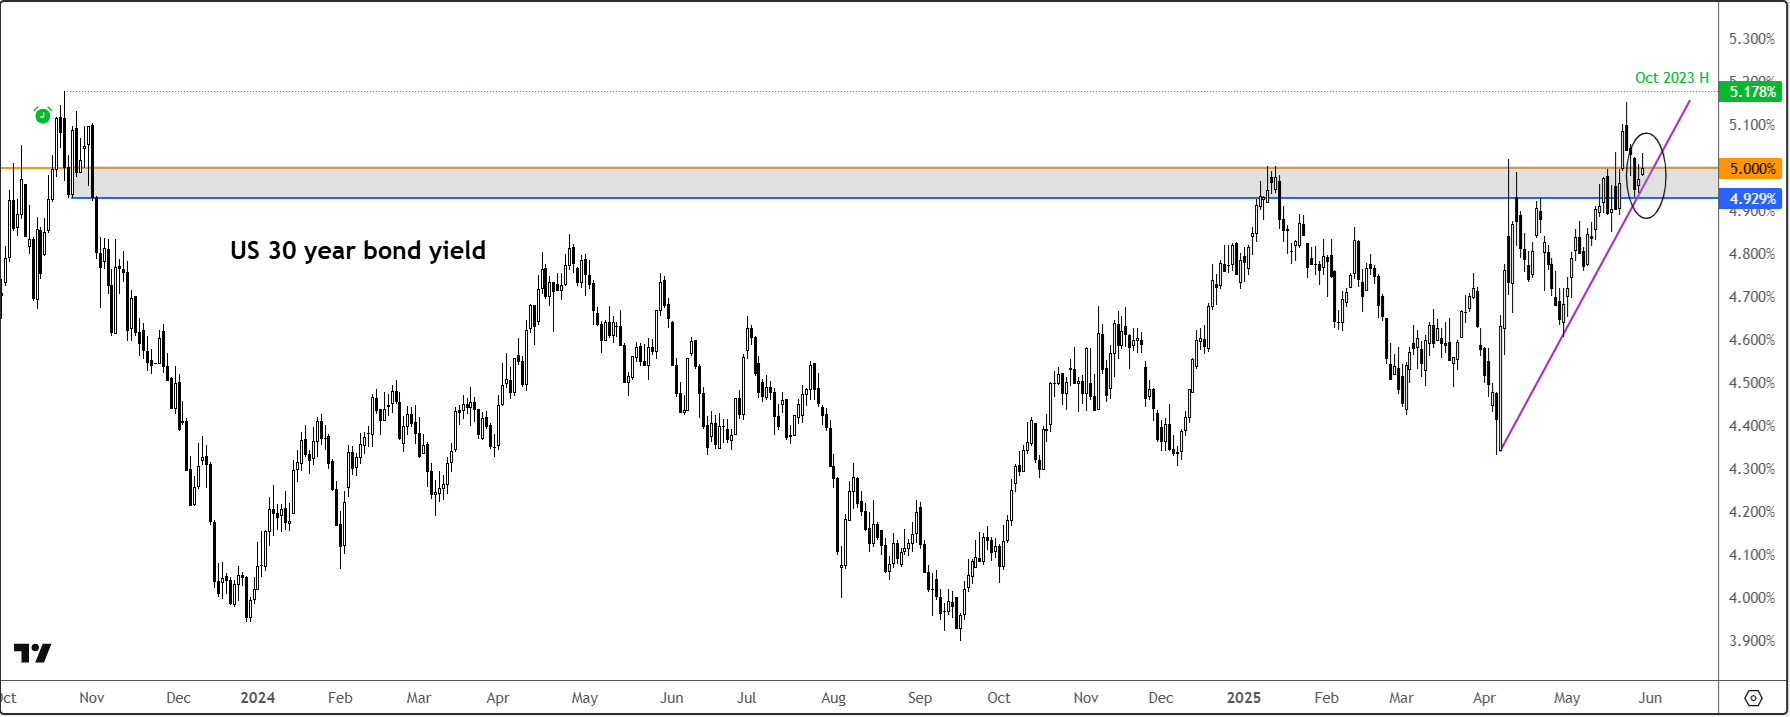
While tech stocks soar, the bond market tells a different story. The US 30-year Treasury yield has risen above 5%, which, if sustained, could potentially trigger risk-off sentiment across markets.
Share this:

- Nasdaq 100 forecast supported by Nvidia’s bullish earnings
- Rising bond yields and debt levels may spoil the rally
- Traders eye US data releases and global inflation prints
The Nasdaq 100 futures rose sharply overnight, riding the wave of Nvidia’s strong earnings and a court ruling that declared most of Trump’s tariffs illegal. On paper, that's bullish—less trade tension, plus a tech giant smashing expectations. But lurking in the background is bond yields, and they’re creeping back above that psychologically dangerous 5% level on the 30-year debt. Japan’s 30 year is also back to near that 3% level, which is something to watch closely as further gains could trigger a risk-off trade. Already, we saw the USD/JPY comes down in excess of 100 pips from its overnight highs, while a few major indices like the FTSE also turned negative on the day. US futures were still largely in the positive territory at the time of writing.
Nvidia powers the optimism – for now
It’s hard to ignore Nvidia’s influence. Shares jumped 6.5% after-hours following a solid revenue outlook that shrugged off slowing demand from China. Nvidia’s plan to ramp up production of its new Blackwell chips gave the AI bulls more fuel, and that helped drag the broader Nasdaq 100 higher. In fact, futures on other major indices also climbed in sympathy, showing just how intertwined Big Tech and market sentiment have become.
But this wasn’t just a tech celebration. The court ruling that most of Trump’s China tariffs are illegal also gave the market something to cheer. Less friction in global trade could theoretically help growth—and by extension, earnings.
Bond yields threaten to cap the rally
Here’s where the Nasdaq 100 forecast gets trickier. While tech stocks soar, the bond market tells a different story. The US 30-year Treasury yield has risen above 5%, which, if sustained, could potentially trigger risk-off sentiment across markets. Concerns over US debt, government spending, and the recent loss of Moody’s top-tier credit rating are leading investors to short Treasuries and the dollar while moving into gold and foreign currencies.
Globally, Japan’s bond market is also under pressure. The government’s shift toward issuing shorter-dated debt and the Bank of Japan's ¥21 trillion reduction in bond holdings have led to weak demand in long-term bond auctions, pushing yields higher. The BOJ is walking a tightrope between inflation control and financial stability, with policy reviews expected in June.
These developments contribute to rising global bond yields, which could redirect capital flows and negatively impact rate-sensitive growth stocks like those in the Nasdaq 100.
Technical Nasdaq 100 forecast: Key levels to watch
While the broader macroeconomic anxieties remain very much in play, they’ve yet to manifest meaningfully in equity prices—at least not just yet. In fact, the recent breakout above the 21,500 mark on the Nasdaq 100 chart offers further encouragement to the bulls. The real question now is whether this level holds firm, or if we see price action slip back beneath it. Should the latter occur, the bullish camp could well find themselves under a bit of pressure. In such a case, a measured pullback wouldn’t come as a surprise. The next notable support resides around 21,170, with the more significant support of 20,200 – 20,300 area coming in below recent low at 20,665.
To the upside, resistance levels are increasingly sparse, owing to the strength of the latest rally. At the time of writing, the Nasdaq 100 was testing the lower end of a resistance range between 21,770 to 21,900. The breakdown from this area back in February triggered a sharp sell-off. The next psychological milestone sits at 22,000, with the former record high at 22,225 thereafter.
Meanwhile, momentum indicators are beginning to flash caution. The RSI is nudging up towards the overbought threshold of 70 once more, which might well tempt a bit of profit-taking at these elevated levels.
In summary
The Nasdaq 100 forecast is caught between two competing forces—tech euphoria and bond market reality. Nvidia may have lit the match in Nasdaq 100 futures, but it’s unclear if that fire can keep burning as yields climb and macro risks pile up. From a technical point of view, though, the trend remains constructive, and dip-buying has, so far, continued to pay dividends. However, with bond yields on the rise, there is a growing risk that this strategy could falter. Should that materialise, traders may wish to consider shifting towards more contrarian, counter-trend approaches.
Source for all charts used in this article: TradingView.com
-- Written by Fawad Razaqzada, Market Analyst
Follow Fawad on Twitter @Trader_F_R
How to trade with City Index
You can trade with City Index by following these four easy steps:
- Open an account, or log in if you’re already a customer
• Open an account in the UK
• Open an account in Australia
• Open an account in Singapore
- Search for the company you want to trade in our award-winning platform
- Choose your position and size, and your stop and limit levels
- Place the trade
Related tags:
Latest market news




The complete CFD trading experience
Award-winning platforms, competitive spreads, low commissions and dedicated support.
We live and breathe the markets and are dedicated to helping traders realise their ambitions as we continue to set the industry bar.
Economic calendar
Web Trader platform
Our sophisticated web-based platform is packed with features.
Related articles
Canadian Dollar Short-term Outlook: USD/CAD Five-Week Rally Hits a Wall at Major Resistance 10 14 2026
USD/CAD is holding near fresh yearly highs, but bearish divergence and a well-defined October range raise the stakes at major resistance.


USD/JPY forecast: hot US CPI lifts the pair above its 200-day average
Hotter-than-expected US inflation has pushed USD/JPY above its 200-day moving average, putting 160 and the risk of Bank of Japan intervention back in focus. The breakout still needs to hold, and a failure could send the pair sharply lower.

Dow Jones outlook: CPI, oil and yields put the rally to the test
US index futures rebounded in the first half of Wednesday’s session, along with European indices ahead of the release of US CPI. Some slightly dovish remarks from the Fed’s Williams seem to have helped sentiment a little, but whether those comments will be backed by data remains to be seen. While slightly hotter than expected inflation data shouldn’t be enough for markets to price in an October Fed hike with more than a coin flip probability, it can nonetheless reinforce expectations of further tightening later in the year.
StoneX Europe Ltd may make third party material available on this website which may contain information included but not limited to the conditions of financial markets. The material is for information purposes only and does not contain, and should not be construed as containing, investment advice and/or investment recommendation and/or an investment research and/or an offer of or solicitation for any transactions in financial instruments; any decision to enter into a specific transaction shall be made by the client following an assessment by him/her of their situation.
StoneX Europe Ltd makes no representation or warranty and assumes no liability as to the accuracy or completeness of the information provided, nor any loss arising from any investment based on a recommendation, forecast or other information supplied. You should always seek independent advice as to your suitability to speculate in any related markets and your ability to assume the associated risks, if you are at all unsure. We are not under any obligation to update any such material. Any opinion made may be personal to the author and may not reflect the opinion of StoneX Europe Ltd.