





Post-FOMC USD Price Action: Can the U.S. Dollar Follow Through?
It’s been a bearish year so far for the USD although the currency has generally shown bullish responses to FOMC meetings. The big question now is whether it can finally find some follow through or whether this is another rally that sellers will fade.
Share this:

USD, FOMC, EUR/USD, USD/JPY, GBP/USD Talking Points:
- The Fed was a bit more-hawkish in today’s forecasts for 2025 rate expectations than last quarter.
- It was the press conference that seemed to be a bigger push point for prices, as Powell didn’t seem to be in a hurry to cut rates. He said ‘the labor market’s not crying out for a rate cut,’ while also discounting the forecasts looking for two cuts into the end of the year, saying ‘no one holds these rate paths with a lot of conviction.’
- The response in USD so far has been bullish, similar to other Fed meetings this year. The big question now is follow-through.
- I’ll look into these themes with some additional feedback in next week’s webinar, and you’re welcome to join. Click here to register.
The Fed was a little bit more hawkish for 2025 in today’s Summary of Economic Projections as compared to March. This installment saw seven votes for no changes to rates this year, up from four in March. Two of those votes came from the one cut camp and one came from a voter that was previously looking for two 25 bp cuts this year.
Markets remain centered on that 50 bp cut expectation but from the sound of Jerome Powell, there remains a massive amount of uncertainty around tariffs, and until that resolves or unless there’s some overriding reason for the bank to push rates, he seems to see little reason to do so. And as he said, ‘the labor market’s not crying out for a rate cut.’
In response the USD moved higher and from the four-hour chart, we can see the currency with a pattern of higher-highs and lows after the early-week re-test of the long-term trendline.
U.S. Dollar Four-Hour Price Chart
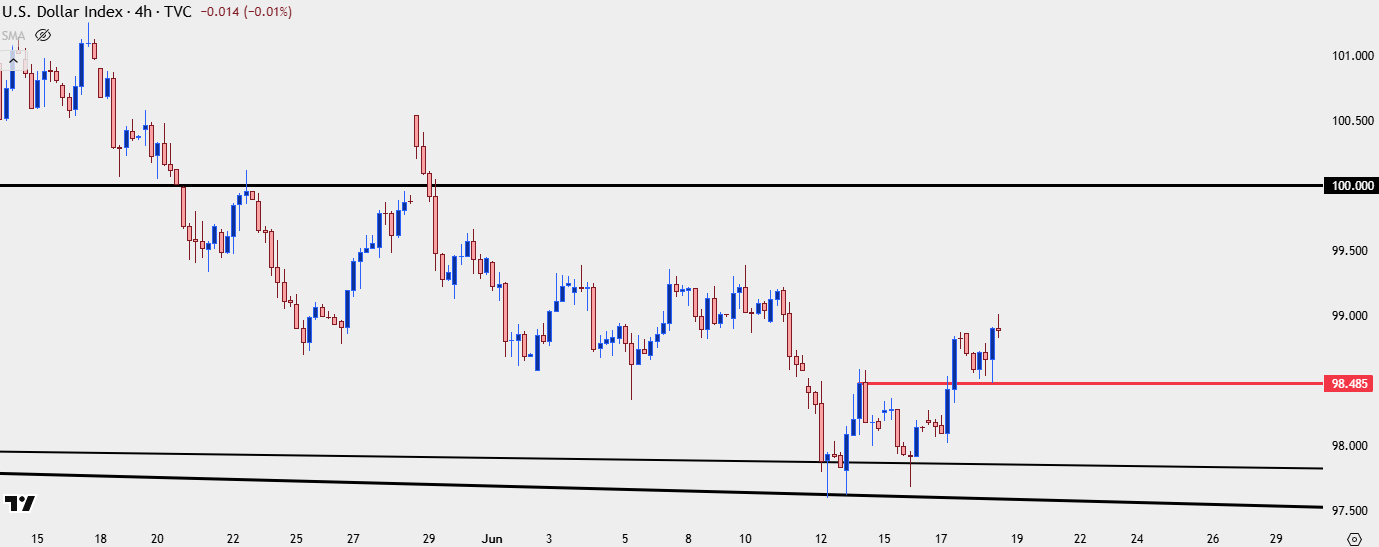 Chart prepared by James Stanley; data derived from Tradingview
USD Daily
The daily chart of USD highlights a falling wedge pattern, often approached with aim of bullish reversal. There’s also been the continued hold of support at the longer-term trendline projection, and a recent case of RSI divergence illustrating just how extended this sell-off has been.
But, again, the important component here will be what the USD has lacked so far this year after FOMC meetings, and that’s follow-through, with each of the prior three rate decisions illustrated on the below chart with vertical lines.
U.S. Dollar Daily Chart
 Chart prepared by James Stanley; data derived from Tradingview
--- written by James Stanley, Senior Strategist
USD, FOMC, EUR/USD, USD/JPY, GBP/USD Talking Points:
- The Fed was a bit more-hawkish in today’s forecasts for 2025 rate expectations than last quarter.
- It was the press conference that seemed to be a bigger push point for prices, as Powell didn’t seem to be in a hurry to cut rates. He said ‘the labor market’s not crying out for a rate cut,’ while also discounting the forecasts looking for two cuts into the end of the year, saying ‘no one holds these rate paths with a lot of conviction.’
- The response in USD so far has been bullish, similar to other Fed meetings this year. The big question now is follow-through.
- I’ll look into these themes with some additional feedback in next week’s webinar, and you’re welcome to join. Click here to register.
The Fed was a little bit more hawkish for 2025 in today’s Summary of Economic Projections as compared to March. This installment saw seven votes for no changes to rates this year, up from four in March. Two of those votes came from the one cut camp and one came from a voter that was previously looking for two 25 bp cuts this year.
Markets remain centered on that 50 bp cut expectation but from the sound of Jerome Powell, there remains a massive amount of uncertainty around tariffs, and until that resolves or unless there’s some overriding reason for the bank to push rates, he seems to see little reason to do so. And as he said, ‘the labor market’s not crying out for a rate cut.’
In response the USD moved higher and from the four-hour chart, we can see the currency with a pattern of higher-highs and lows after the early-week re-test of the long-term trendline.
U.S. Dollar Four-Hour Price Chart
Chart prepared by James Stanley; data derived from Tradingview
USD Daily
The daily chart of USD highlights a falling wedge pattern, often approached with aim of bullish reversal. There’s also been the continued hold of support at the longer-term trendline projection, and a recent case of RSI divergence illustrating just how extended this sell-off has been.
But, again, the important component here will be what the USD has lacked so far this year after FOMC meetings, and that’s follow-through, with each of the prior three rate decisions illustrated on the below chart with vertical lines.
U.S. Dollar Daily Chart
Chart prepared by James Stanley; data derived from Tradingview
--- written by James Stanley, Senior Strategist
Related tags:



The complete CFD trading experience
Award-winning platforms, competitive spreads, low commissions and dedicated support.
We live and breathe the markets and are dedicated to helping traders realise their ambitions as we continue to set the industry bar.
Economic calendar
Web Trader platform
Our sophisticated web-based platform is packed with features.
Related articles

USD Sets Fresh Yearly High as EUR/USD Drops Dramatically, USD/JPY Stable
Well, it was a week of USD strength that wasn’t entirely pushed by USD/JPY, as a strong sell-off in EUR/USD has pushed the major pair to its most oversold state in a decade.

Dow Jones Forecast: DJIA rises after weaker jobs data
U.S. stocks are rising after weaker-than-expected U.S. jobs data saw markets rein in rate hike expectations.


What Stretched 10-Year Yields Mean for Major Currency Pairs in Q4
U.S. 10-year Treasury yields are nearing a long-term resistance zone with overbought RSI readings, raising near-term pullback risk for the dollar.

StoneX Europe Ltd may make third party material available on this website which may contain information included but not limited to the conditions of financial markets. The material is for information purposes only and does not contain, and should not be construed as containing, investment advice and/or investment recommendation and/or an investment research and/or an offer of or solicitation for any transactions in financial instruments; any decision to enter into a specific transaction shall be made by the client following an assessment by him/her of their situation.
StoneX Europe Ltd makes no representation or warranty and assumes no liability as to the accuracy or completeness of the information provided, nor any loss arising from any investment based on a recommendation, forecast or other information supplied. You should always seek independent advice as to your suitability to speculate in any related markets and your ability to assume the associated risks, if you are at all unsure. We are not under any obligation to update any such material. Any opinion made may be personal to the author and may not reflect the opinion of StoneX Europe Ltd.