



S&P 500, Nasdaq, Dow Forecast for the Week Ahead
Equities were mixed for the month with the S&P 500 and Nasdaq closing lower as the Dow marks a ten-month winning streak. Levels that matter heading into March.
Share this:

Equity Indices Technical Forecast: Weekly Trade Levels
- U.S. equities were mixed into the close of February with the S&P 500 and the Nasdaq down 0.93% and 2.3% respectively while the Dow rose just 0.17%.
- S&P 500 snaps a nine-week winning streak with price consolidating within the February opening-range, just below resistance- breakout pending.
- Nasdaq suffered the largest decline, and the outlook remains vulnerable with the index trading just above uptrend support.
- Dow posts tenth consecutive monthly advance with February range intact- breakout pending.
Review my latest Weekly Strategy Webinar for an in-depth breakdown of these equity indices and more. Join the session or stream live on YouTube on Monday’s at 8:30am EST.
S&P 500 Price Chart – SPX500 Weekly
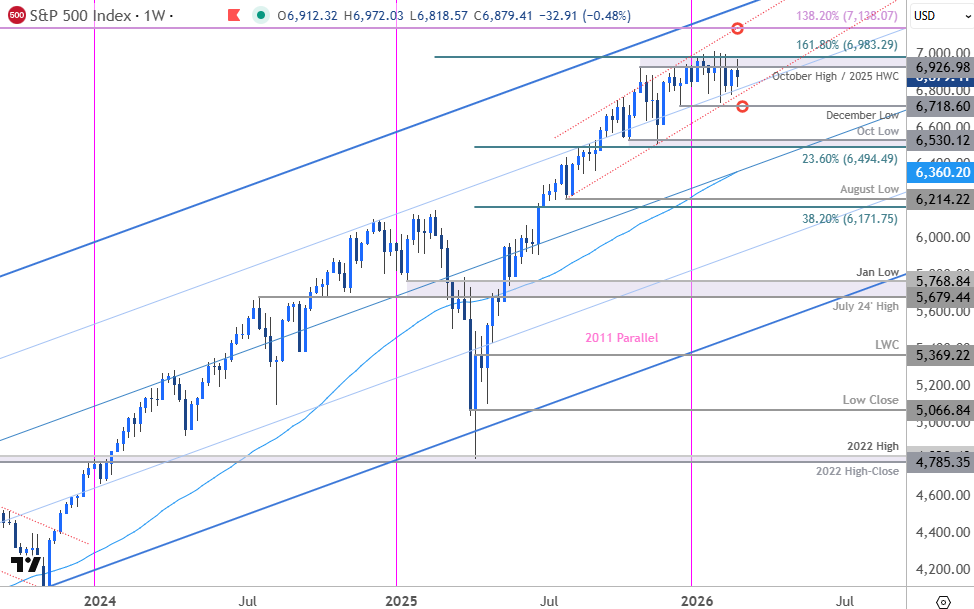
Chart Prepared by Michael Boutros, Sr. Technical Strategist; S&P 500 on TradingView
Technical Outlook: In my last Equity Indices Forecast we noted that the S&P 500 was back at, “a key resistance zone that has capped the equity rally since October. From a trading standpoint, losses would need to be limited to 6704 IF the index is heading higher on this stretch with a close above 6990 needed to mark uptrend resumption.” The index held below key resistance for the entire month at 6927/90- a region defined by the October high, the 2025 high-week close (HWC), the 1.618% extension of the 2025 opening-range, and the January (record) high-close. The SPX500 snapped a nine-month winning streak with the February opening-range intact heading into March. The focus is on a breakout in the weeks ahead to offer guidance. Although the broader outlook is still constructive, the advance remains vulnerable while below this key zone.
S&P 500 Price Chart – SPX500 Daily
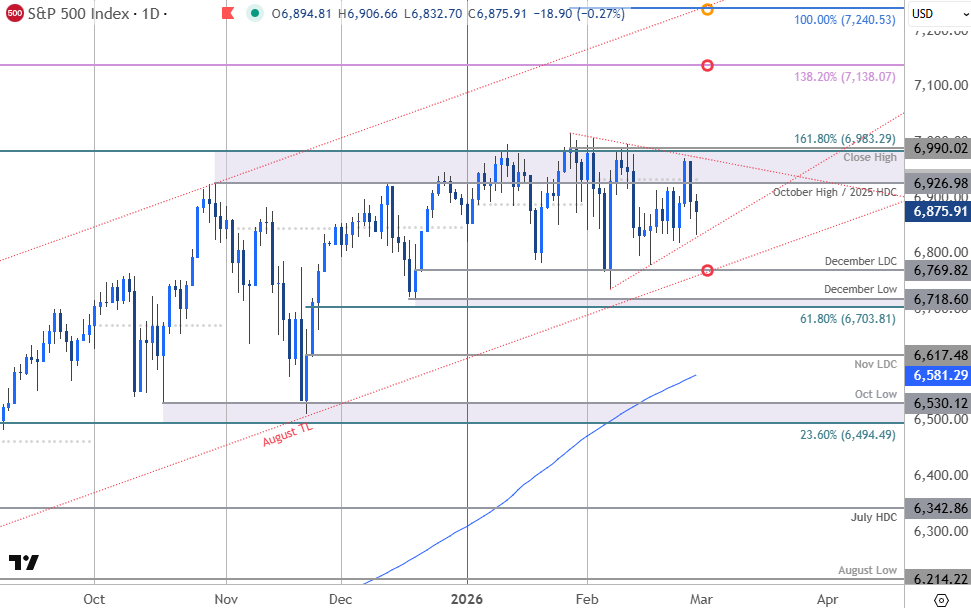
Chart Prepared by Michael Boutros, Sr. Technical Strategist; S&P 500 on TradingView
A closer look at the S&P 500 daily chart shows the index stalling at resistance into the close of the month with price continuing to consolidate into the apex of a multi-week triangle formation. Support rests with the December low-day close (LDC) at 6770 with key support steady at the 61.8% retracement of the November rally and the December low at 6704/19. Note that the August trendline converges on this threshold over the next few days and a break / close below this slope would be needed to suggest a more significant high is in place and a larger reversal is underway. Subsequent support seen at the November LDC at 6617 and the 200-day moving average near ~6581.
A topside breach / daily close above 6690 is needed to mark resumption of the broader uptrend. Subsequent resistance objectives are eyed at the 1.382% extension of the broader 2020 advance near 7138 and the 100% extension of the November rally at 7240.
Bottom line: The S&P 500 is consolidating within the February range. The focus is on a breakout heading into March with the multi-month uptrend vulnerable while below resistance. From a trading standpoint, losses would need to be limited to 6770 IF price is heading higher on this stretch with a close above 6990 needed to fuel the next major leg of the advance.

Nasdaq Price Chart – NDX Weekly
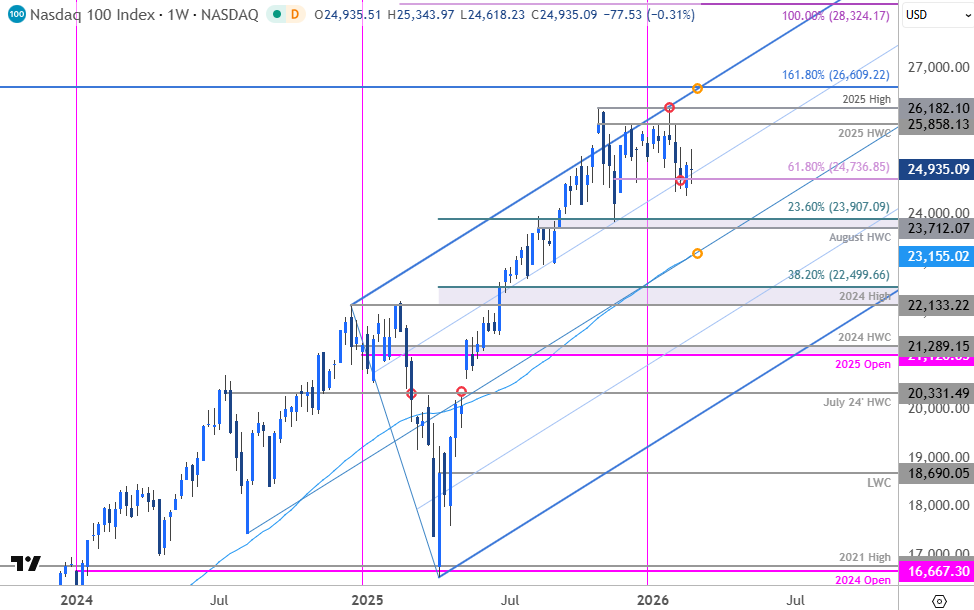
Chart Prepared by Michael Boutros, Sr. Technical Strategist; NDX on TradingView
Technical Outlook: The Nasdaq was the worst performer of the three major indices with a decline of more than 2.3% in February. The index has fallen more than 6.7% off the January high with the bears testing confluent support this month at the 61.8% retracement of the November rally near 24,737. Despite numerous attempts, the index was unable to mark a weekly close below and for now keeps the August uptrend intact heading into March.
Weekly resistance is eyed at the 2025 high-week close (HWC) at 25,858 and is backed closely by the 2025 swing high at 26,182 and the 1.618% extension of the broader 2020 advance at 26,609. Note that the upper parallel converges on this threshold over the next few weeks and a breach / close above this threshold is needed to fuel the next major leg of the advance. Look for a larger reaction there IF reached.
A break below the February range low would threaten a larger correction in the Nasdaq. Such a scenario would expose subsequent support objectives at the August high-week close (HWC) and the 23.6% retracement of the 2025 advance at 23,712/907 and the 52-week average near ~23,155. Note that the median-line converges on this threshold early in the month and losses below this level would suggest a more significant trend reversal is underway.
Bottom line: The tech-heavy Nasdaq remains the most vulnerable of the major indices with price trading just above uptrend support. From a trading standpoint, rallies would need to be limited to the February open at 25,491 IF price is heading for a deeper correction here with a weekly close below 24,736 needed to fuel the next leg of the decline.
Dow Jones Price Chart – DJI Weekly
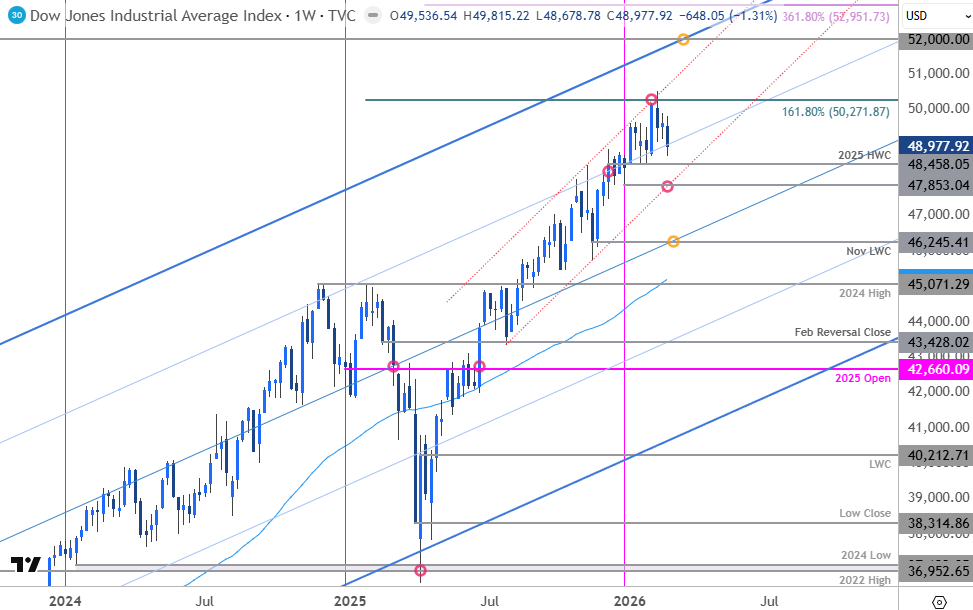
Chart Prepared by Michael Boutros, Sr. Technical Strategist; DJI on TradingView
Technical Outlook: The Dow was the only index to close in the black last month with DJI eking out a gain of just 0.17%. The rally exhausted at confluent resistance mid-month near the 1.618% extension of the 2025 range breakout at 50,272. Since then, price has fallen more than 3.6% with the February opening-range intact heading into March. Look for a breakout to offer guidance here in the weeks ahead.
Initial weekly support rests at the 2025 high-week close (HWC) at 48,458 and is backed by the January swing low at 47,853. Note that the August channel line converges on this threshold next week and losses below this threshold would suggest a more significant high is in place and a larger correction is underway. Subsequent support rests with the November low-week close (LWC) at 46,245 which converges on the median-line over the next few weeks. Look for a larger reaction there IF reached.
A topside breach / weekly close above 50,272 is needed to mark uptrend resumption towards channel resistance (currently near 50,900). Subsequent resistance objectives are eyed at 52,000 and the 3.618% extension of the April advance at 52,951.
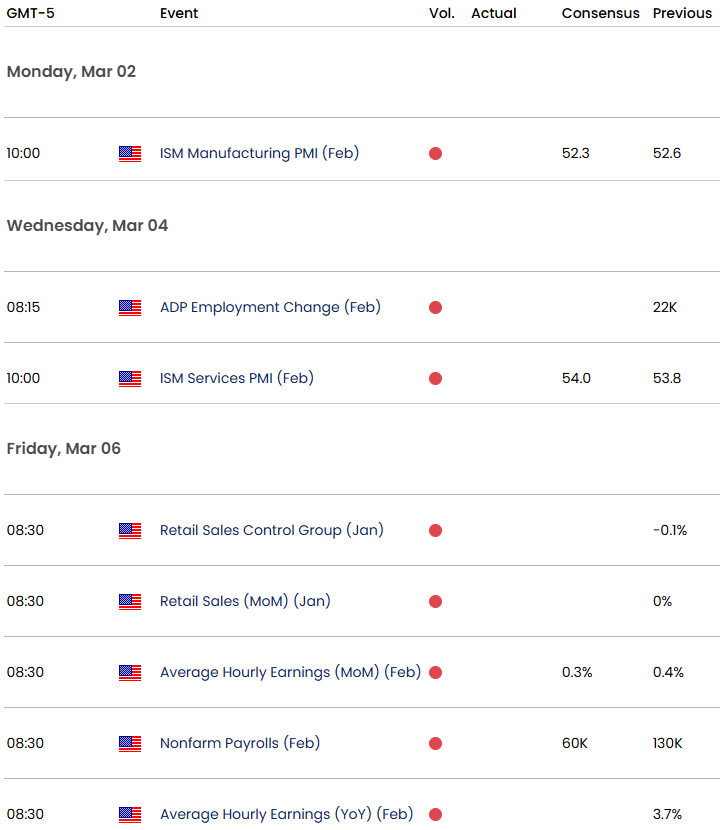
Bottom line: The Dow reversed off uptrend resistance this month and the threat remains for a larger pullback within the August channel. From a trading standpoint, losses would need to be limited to 47,853 IF price is heading higher on this stretch with a close above 50,272 needed to fuel the next major leg of the advance. Keep in mind we get the release of ISM data, retail sales, and the highly anticipated February Non-Farm Payroll next week. Stay nimble into the releases and watch the weekly closes here for guidance.
Key US Economic Data Releases
Active Weekly Technical Charts
- Swiss Franc (USD/CHF)
- Crude Oil (WTI)
- Bitcoin (BTC/USD)
- Japanese Yen (USD/JPY)
- Gold (XAU/USD)
- Euro (EUR/USD)
- Australian Dollar (AUD/USD)
- Canadian Dollar (USD/CAD)
- British Pound (GBP/USD)
- US Dollar Index (DXY)
--- Written by Michael Boutros, Senior Technical Strategist
Follow Michael on X @MBForex
Latest market news




The complete CFD trading experience
Award-winning platforms, competitive spreads, low commissions and dedicated support.
We live and breathe the markets and are dedicated to helping traders realise their ambitions as we continue to set the industry bar.
Economic calendar
Web Trader platform
Our sophisticated web-based platform is packed with features.
Related articles
Swiss Franc Forecast: USD/CHF Seven-Week Rally Reverses From Yearly Highs 10 16 2026
A sharp rejection from fresh highs has shifted momentum in favor of USD/CHF bears, raising the stakes for a critical support test.
S&P 500 Forecast: SPX set for a weekly decline led lower by tech as AI worries linger
U.S. stocks have opened mixed as investors continue to worry about the financing behind the AI trade while also looking ahead to more earnings next week.

Magnificent Seven Earnings Preview: Is the AI Boom Facing Its Biggest Test Yet?
After a wobble in the broader AI trade, the Magnificent Seven" stocks are reporting earnings in the coming week - see the key themes and Nasdaq 100 levels to watch!

StoneX Europe Ltd may make third party material available on this website which may contain information included but not limited to the conditions of financial markets. The material is for information purposes only and does not contain, and should not be construed as containing, investment advice and/or investment recommendation and/or an investment research and/or an offer of or solicitation for any transactions in financial instruments; any decision to enter into a specific transaction shall be made by the client following an assessment by him/her of their situation.
StoneX Europe Ltd makes no representation or warranty and assumes no liability as to the accuracy or completeness of the information provided, nor any loss arising from any investment based on a recommendation, forecast or other information supplied. You should always seek independent advice as to your suitability to speculate in any related markets and your ability to assume the associated risks, if you are at all unsure. We are not under any obligation to update any such material. Any opinion made may be personal to the author and may not reflect the opinion of StoneX Europe Ltd.