



Softer US data sends US Dollar lower
If the data continues to come out weak for the US, it could mean a move dovish Fed than expected.
Share this:

When trying to determine what the Fed will do at its next meeting, there are many variables that come into play. Retail Sales inflation data and manufacturing data are a few of the most important factors. December Retail Sales showed that shoppers spent less in December as the MoM print was -1.1% vs an expectation of -0.8% and a November reading of -1.0% (revised from -0.6%). In addition, Retails Sales (ex-Autos) was also -1.1% MoM vs an expectation of -0.4% MoM and a November reading of -0.6% MoM (revised from -0.2% MoM).
US PPI was also weaker than expected. Headline PPI fell to 6.2% YoY vs an expectation of 6.8% YoY and a prior reading of 7.3% YoY (revised from 7.4% YoY). This is the lowest PPI reading since March 2021.
Adding fuel to the fire are Industrial Production and Manufacturing Production for December. Both prints were weaker than expected, suggesting that the soft-landing scenario the Fed has painted may not be so cut and dry. Industrial Production was -0.7% MoM vs an expectation of -0.1% MoM and a November reading of -0.6% MoM (revised of -0.2%). This was the biggest decline since September 2021. Manufacturing Production was also weaker at -1.3% MoM vs an expectation of -0.3% MoM and a November reading of -1.1% MoM (revised from -0.6%). This was the largest decrease in the data series since February 2021.
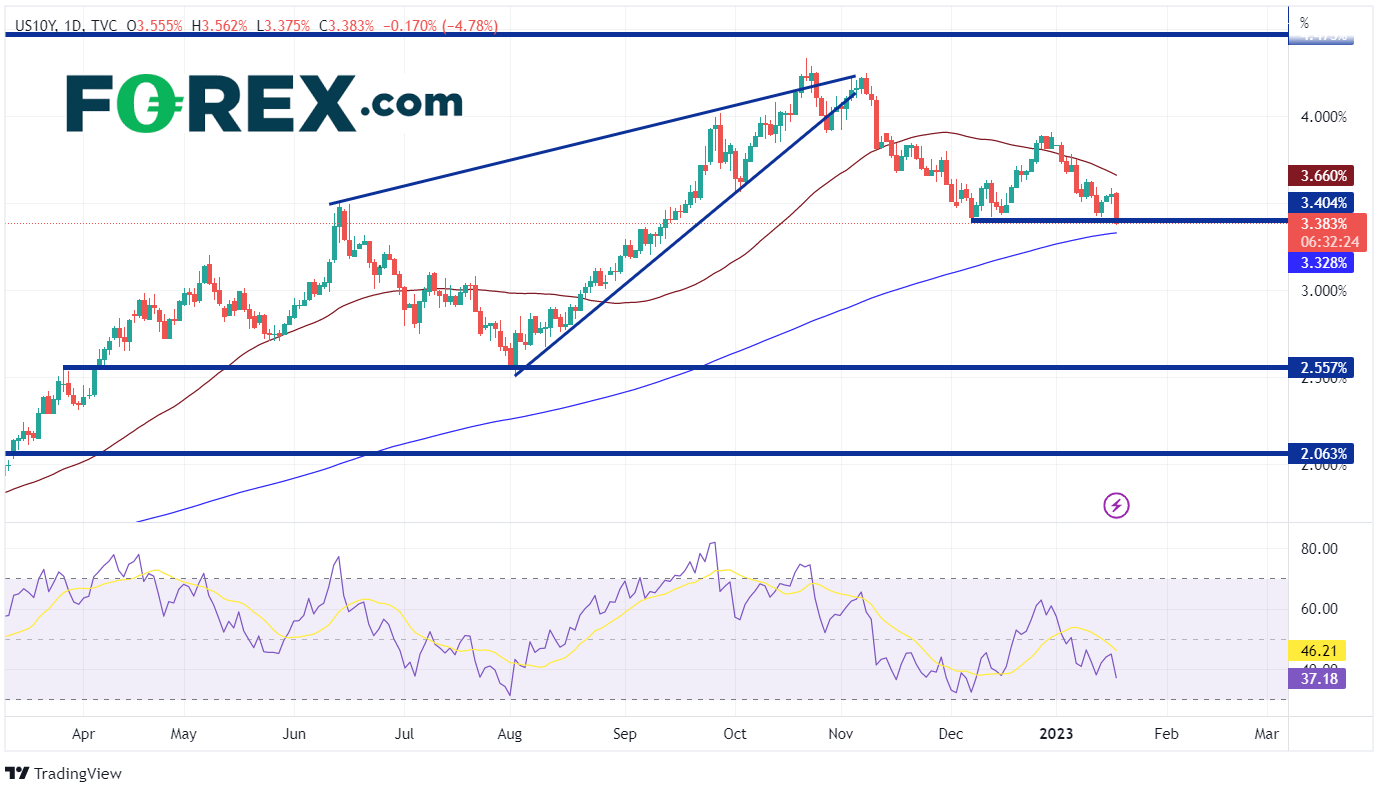
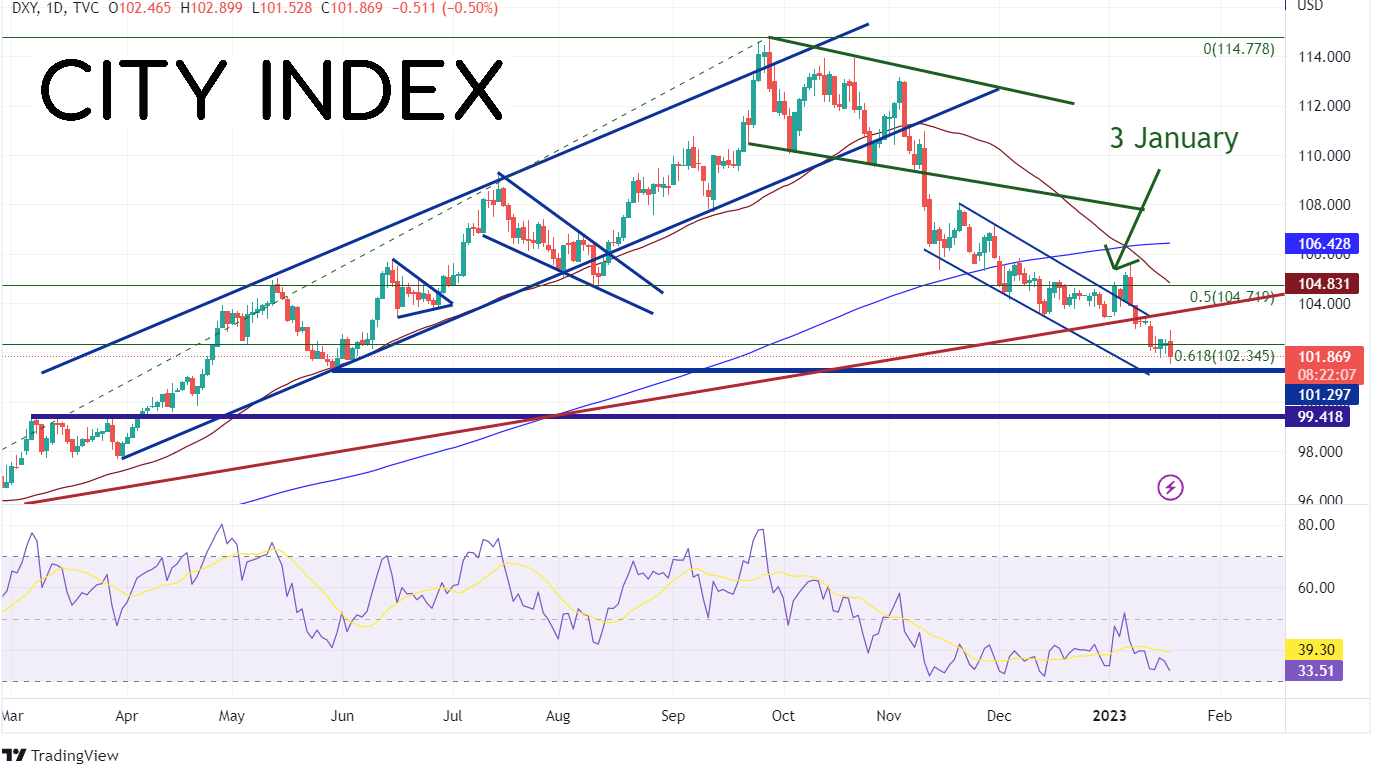
Weaker retail sales, inflation, and manufacturing data point to a more dovish Fed when it meets on February 1st. This is pushing interest rates and the US Dollar lower. US 10-year yields fell to their lowest level since mid-September 2022 at 3.375% while the DXY is closing on May 30th, 2022 support at 101.30.
US 10 Year Daily
Source: Tradingview, Stone X
DXY Daily

Source: Tradingview, Stone X
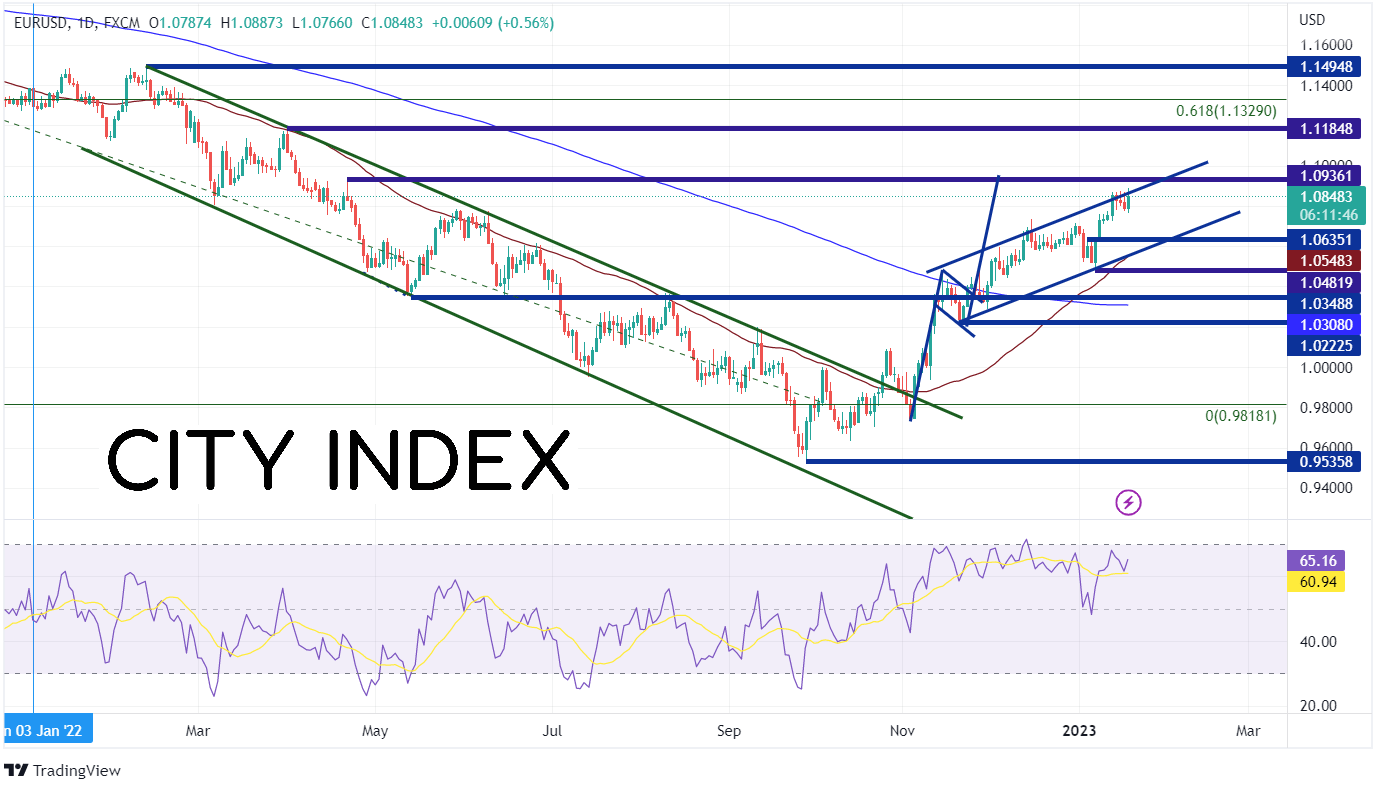
With the BOJ and UK inflation earlier today, it's best to take a look at EUR/USD, as the Eurozone didn’t have much skin in the game today. On a daily timeframe, EUR/USD reached its highest level since April 21st, 2022 as US Dollar weakness helped push the pair higher. Price is currently testing the top trendline of the channel, which began in November 2022, near 1.0865. If the US Dollar continues to weaken, the pair should remain bid. First resistance is at the highs of April 21st at 1.0936. Above there, EUR/USD can move to the highs of March 31st, 2022 at 1.1185, then the 61.8% Fibonacci retracement level from the highs of May 2021 to the lows of September 2022, at 1.1329. However, if EUR/USD pulls back, the first support is at the highs from January 4th at 1.0635. Below there, price can test a confluence of support at the 50 Day Moving Average and the bottom trendline of the channel near 1.0548. Next support is the lows of January 6th at 1.0482.

Source: Tradingview, Stone X
If the data continues to come out weak for the US, it could mean a move dovish Fed than expected on the back of weaker inflation and the possibility of a hard landing. On Thursday and Friday, the US releases housing data and the Philadelphia Fed Manufacturing Index. Manage risk accordingly.
When trying to determine what the Fed will do at its next meeting, there are many variables that come into play. Retail Sales inflation data and manufacturing data are a few of the most important factors. December Retail Sales showed that shoppers spent less in December as the MoM print was -1.1% vs an expectation of -0.8% and a November reading of -1.0% (revised from -0.6%). In addition, Retails Sales (ex-Autos) was also -1.1% MoM vs an expectation of -0.4% MoM and a November reading of -0.6% MoM (revised from -0.2% MoM).
US PPI was also weaker than expected. Headline PPI fell to 6.2% YoY vs an expectation of 6.8% YoY and a prior reading of 7.3% YoY (revised from 7.4% YoY). This is the lowest PPI reading since March 2021.
Adding fuel to the fire are Industrial Production and Manufacturing Production for December. Both prints were weaker than expected, suggesting that the soft-landing scenario the Fed has painted may not be so cut and dry. Industrial Production was -0.7% MoM vs an expectation of -0.1% MoM and a November reading of -0.6% MoM (revised of -0.2%). This was the biggest decline since September 2021. Manufacturing Production was also weaker at -1.3% MoM vs an expectation of -0.3% MoM and a November reading of -1.1% MoM (revised from -0.6%). This was the largest decrease in the data series since February 2021.
Weaker retail sales, inflation, and manufacturing data point to a more dovish Fed when it meets on February 1st. This is pushing interest rates and the US Dollar lower. US 10-year yields fell to their lowest level since mid-September 2022 at 3.375% while the DXY is closing on May 30th, 2022 support at 101.30.
US 10 Year Daily

Source: Tradingview, Stone X
DXY Daily
Source: Tradingview, Stone X
Trade the DXY now: Login or Open a new account!
• Open an account in the UK
• Open an account in Australia
• Open an account in Singapore
With the BOJ and UK inflation earlier today, it's best to take a look at EUR/USD, as the Eurozone didn’t have much skin in the game today. On a daily timeframe, EUR/USD reached its highest level since April 21st, 2022 as US Dollar weakness helped push the pair higher. Price is currently testing the top trendline of the channel, which began in November 2022, near 1.0865. If the US Dollar continues to weaken, the pair should remain bid. First resistance is at the highs of April 21st at 1.0936. Above there, EUR/USD can move to the highs of March 31st, 2022 at 1.1185, then the 61.8% Fibonacci retracement level from the highs of May 2021 to the lows of September 2022, at 1.1329. However, if EUR/USD pulls back, the first support is at the highs from January 4th at 1.0635. Below there, price can test a confluence of support at the 50 Day Moving Average and the bottom trendline of the channel near 1.0548. Next support is the lows of January 6th at 1.0482.
Source: Tradingview, Stone X
Trade EUR/USD now: Login or Open a new account!
• Open an account in the UK
• Open an account in Australia
• Open an account in Singapore
If the data continues to come out weak for the US, it could mean a move dovish Fed than expected on the back of weaker inflation and the possibility of a hard landing. On Thursday and Friday, the US releases housing data and the Philadelphia Fed Manufacturing Index. Manage risk accordingly.
Learn more about forex trading opportunities.
Related tags:
Latest market news




The complete CFD trading experience
Award-winning platforms, competitive spreads, low commissions and dedicated support.
We live and breathe the markets and are dedicated to helping traders realise their ambitions as we continue to set the industry bar.
Economic calendar
Web Trader platform
Our sophisticated web-based platform is packed with features.
Related articles
Canadian Dollar Short-term Outlook: USD/CAD Five-Week Rally Hits a Wall at Major Resistance 10 14 2026
USD/CAD is holding near fresh yearly highs, but bearish divergence and a well-defined October range raise the stakes at major resistance.

EUR/USD Analysis: Euro Loses Ground After a Stronger-Than-Expected U.S. CPI Report
The trading week continues to unfold and weakness around the euro has once again become increasingly evident in the short term. This can be seen in the recent performance of EUR/USD, which has declined roughly 0.3% over the last three trading sessions, highlighting renewed strength in the U.S. dollar.

USD/JPY forecast: hot US CPI lifts the pair above its 200-day average
Hotter-than-expected US inflation has pushed USD/JPY above its 200-day moving average, putting 160 and the risk of Bank of Japan intervention back in focus. The breakout still needs to hold, and a failure could send the pair sharply lower.

StoneX Europe Ltd may make third party material available on this website which may contain information included but not limited to the conditions of financial markets. The material is for information purposes only and does not contain, and should not be construed as containing, investment advice and/or investment recommendation and/or an investment research and/or an offer of or solicitation for any transactions in financial instruments; any decision to enter into a specific transaction shall be made by the client following an assessment by him/her of their situation.
StoneX Europe Ltd makes no representation or warranty and assumes no liability as to the accuracy or completeness of the information provided, nor any loss arising from any investment based on a recommendation, forecast or other information supplied. You should always seek independent advice as to your suitability to speculate in any related markets and your ability to assume the associated risks, if you are at all unsure. We are not under any obligation to update any such material. Any opinion made may be personal to the author and may not reflect the opinion of StoneX Europe Ltd.