



US Housing Market continues to show signs of weakness; USD/JPY
Watching US 10-Year Yields and USD/JPY could give a clue as to the next direction for mortgage rates.
Share this:

KEY TAKEAWAYS
- Recent US Existing Home Sales and Mortgage data weaker than expected
- Mortgage Rates are dependent on 10-Year Yields, which are at their highest level in since November 10th
- USD/JPY has a strong correlation with US 10-Year Yields
On Tuesday, the US released Existing Home Sales data for January. The print fell to -0.7% MoM vs an expectation of 2% MoM and a lower December revision from -1.5% MoM to -2.2% MoM. Existing Home Sales have been negative for over a year. The actual number of Existing Home Sales fell to 4,000,000 vs an expectation of 4,100,000 and a prior reading of 4,030,000. This was the twelfth month in a row the data series has decreased and the lowest reading since October 2010. Today’s MBA Mortgage data for the week ending February 17th shows that the slow housing data may continue. Mortgage applications dropped -13.3% vs a prior reading of -7.7%. This was the biggest decrease since the last week of September. As for the MBA Purchase Index, it fell -18.1% to 147.10. This was the lowest reading since May 1995! The reason for the weakness: higher interest rates. The average interest rate for a 30-year fixed-rate mortgages increased 23bps from the prior week to 6.62%. This was the highest level since mid-November 2022. On Friday, the US will release data for New Homes Sales for January. Expectations are for an increase of only 0.4% MoM vs a December reading of 2.3% MoM. Will the soft housing data for January continue?
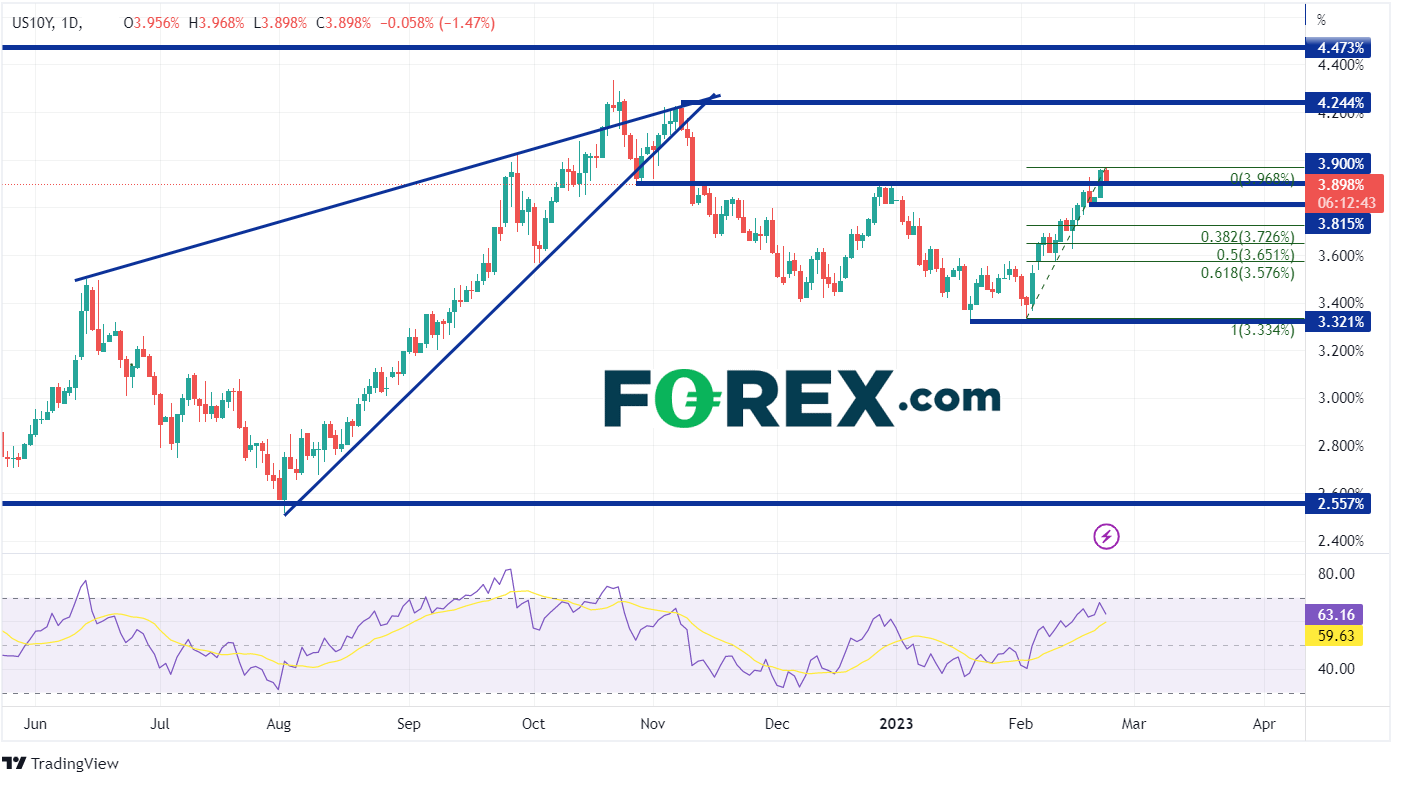
Mortgage rates typically follow that of the 10-Year Yield (with a premium). In the chart below, 10-Year Yields have reached their highest level since November 10th at 3.968%. The next resistance level isn’t until the highs from November 8th, 2022 at 4.244%, then the highs from October 21st, 2022 at 4.335%. However, if yields pull back, first support is at the February 17th lows of 3.815%. Below there, the next support is the 38.2% Fibonacci retracement level from the lows of February 2nd to the highs of February 22nd at 3.726%, then the 50% retracement level from the same timeframe at 3.651%.
Source: Tradingview, Stone X
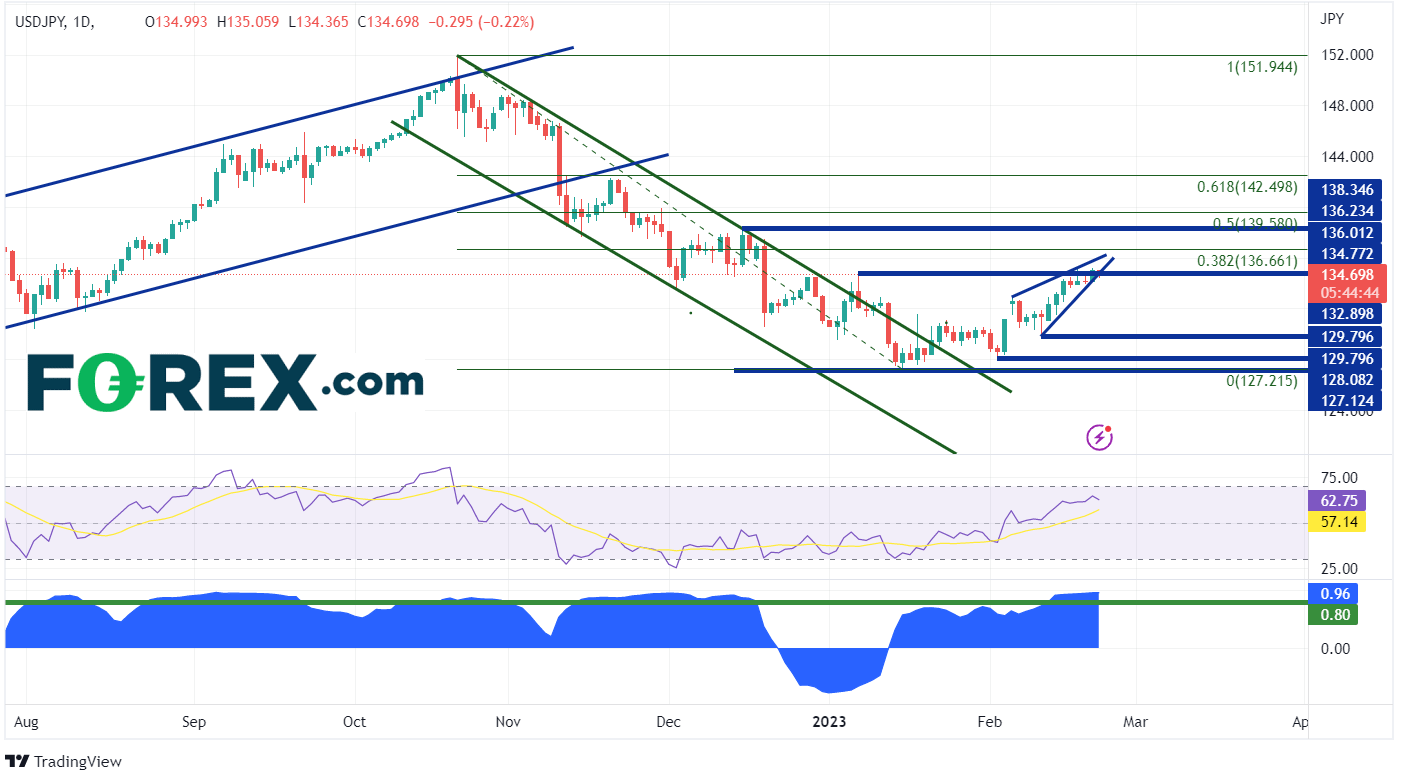
Mortgage rates aren’t the only asset affected by the 10-Year Yield. Notice in the bottom panel of the chart below on a daily timeframe, USD/JPY and US 10-Year Yields have a correlation coefficient of +0.96. Readings above +0.96 are considered to have a strong correlation. For reference, a reading of +1.00 means that the 2 assets have a perfect positive correlation and move in the same direction 100% of the time. USD/JPY is currently in an ascending wedge. If the pair breaks lower from the ascending wedge, as expected, it could pull back to the target at 129.80. If the correlation holds, this will pull 10-Year Yields lower with it. Below there, USD/JPY could fall to the lows of February 2nd at 128.08, then the lows from January 16th at 127.12. However, if the pair moves higher, it could bring 10-Year Yields higher with it. First resistance is at the 38.2% Fibonacci retracement level from the highs of October 21st, 2022 to the lows of January 16th at 136.66. Above there, the highs from December 15th, 2022 sit at 138.35, then the 50% retracement from the previously mentioned timeframe at 139.58.
Source: Tradingview, Stone X
Recent US housing data has come in weaker than expected due to the increase in mortgage rates, which are influenced by the increase in the US 10-Year Yield. USD/JPY are also correlation with US 10-Year Yields. Therefore, watching US 10-Year Yields and USD/JPY could give a clue as to the next direction for mortgage rates.
KEY TAKEAWAYS
- Recent US Existing Home Sales and Mortgage data weaker than expected
- Mortgage Rates are dependent on 10-Year Yields, which are at their highest level in since November 10th
- USD/JPY has a strong correlation with US 10-Year Yields
On Tuesday, the US released Existing Home Sales data for January. The print fell to -0.7% MoM vs an expectation of 2% MoM and a lower December revision from -1.5% MoM to -2.2% MoM. Existing Home Sales have been negative for over a year. The actual number of Existing Home Sales fell to 4,000,000 vs an expectation of 4,100,000 and a prior reading of 4,030,000. This was the twelfth month in a row the data series has decreased and the lowest reading since October 2010. Today’s MBA Mortgage data for the week ending February 17th shows that the slow housing data may continue. Mortgage applications dropped -13.3% vs a prior reading of -7.7%. This was the biggest decrease since the last week of September. As for the MBA Purchase Index, it fell -18.1% to 147.10. This was the lowest reading since May 1995! The reason for the weakness: higher interest rates. The average interest rate for a 30-year fixed-rate mortgages increased 23bps from the prior week to 6.62%. This was the highest level since mid-November 2022. On Friday, the US will release data for New Homes Sales for January. Expectations are for an increase of only 0.4% MoM vs a December reading of 2.3% MoM. Will the soft housing data for January continue?
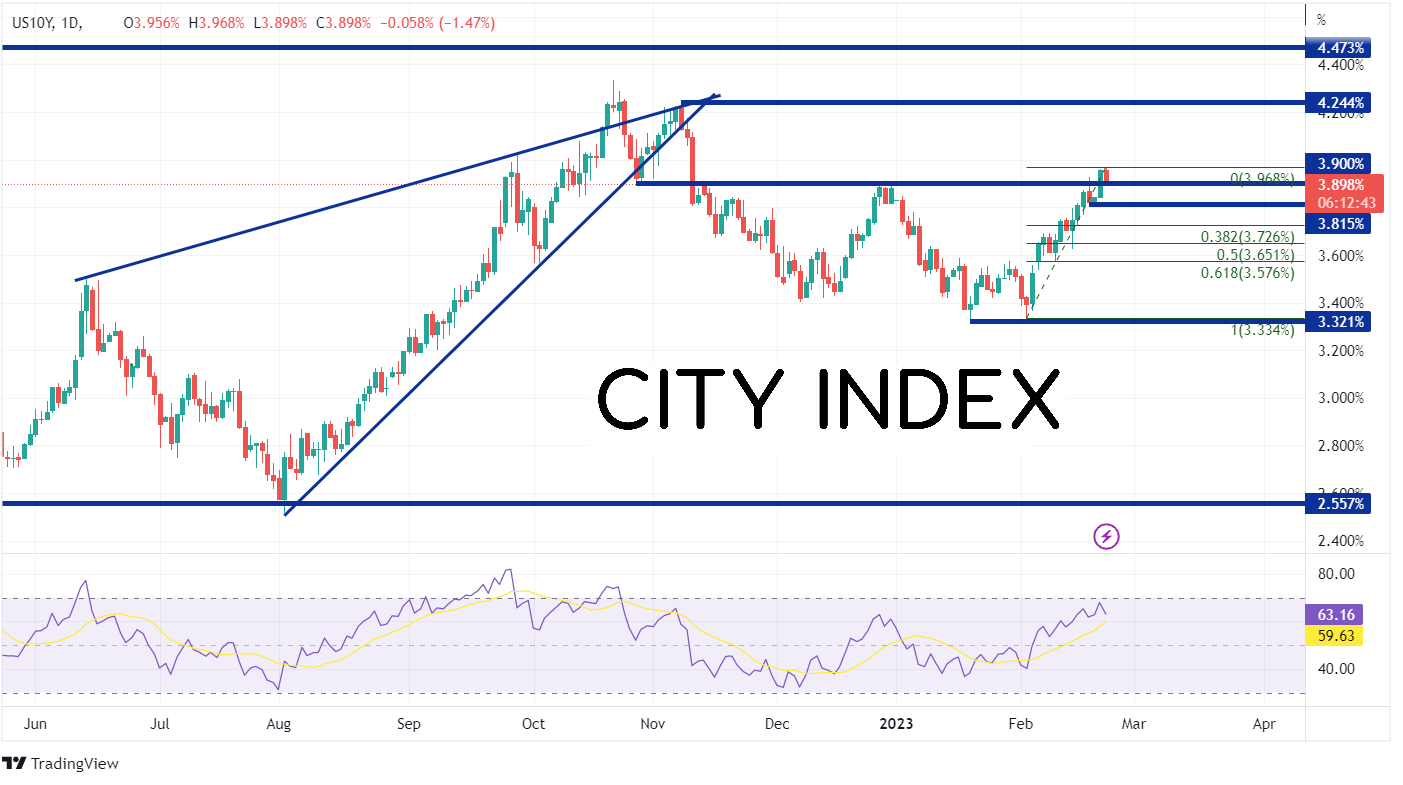
Mortgage rates typically follow that of the 10-Year Yield (with a premium). In the chart below, 10-Year Yields have reached their highest level since November 10th at 3.968%. The next resistance level isn’t until the highs from November 8th, 2022 at 4.244%, then the highs from October 21st, 2022 at 4.335%. However, if yields pull back, first support is at the February 17th lows of 3.815%. Below there, the next support is the 38.2% Fibonacci retracement level from the lows of February 2nd to the highs of February 22nd at 3.726%, then the 50% retracement level from the same timeframe at 3.651%.
Source: Tradingview, Stone X
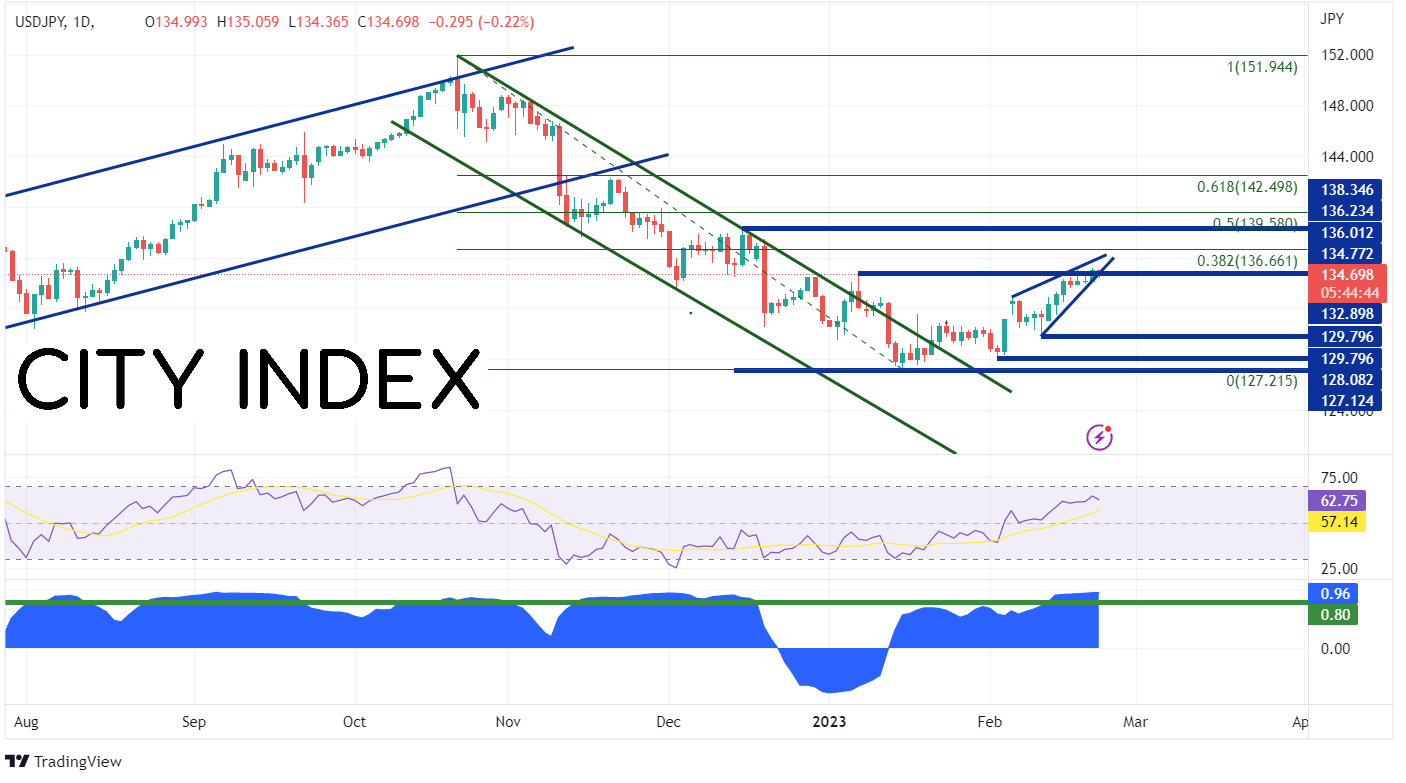
Mortgage rates aren’t the only asset affected by the 10-Year Yield. Notice in the bottom panel of the chart below on a daily timeframe, USD/JPY and US 10-Year Yields have a correlation coefficient of +0.96. Readings above +0.96 are considered to have a strong correlation. For reference, a reading of +1.00 means that the 2 assets have a perfect positive correlation and move in the same direction 100% of the time. USD/JPY is currently in an ascending wedge. If the pair breaks lower from the ascending wedge, as expected, it could pull back to the target at 129.80. If the correlation holds, this will pull 10-Year Yields lower with it. Below there, USD/JPY could fall to the lows of February 2nd at 128.08, then the lows from January 16th at 127.12. However, if the pair moves higher, it could bring 10-Year Yields higher with it. First resistance is at the 38.2% Fibonacci retracement level from the highs of October 21st, 2022 to the lows of January 16th at 136.66. Above there, the highs from December 15th, 2022 sit at 138.35, then the 50% retracement from the previously mentioned timeframe at 139.58.
Source: Tradingview, Stone X
Trade USD/JPY now: Login or Open a new account!
• Open an account in the UK
• Open an account in Australia
• Open an account in Singapore
Recent US housing data has come in weaker than expected due to the increase in mortgage rates, which are influenced by the increase in the US 10-Year Yield. USD/JPY are also correlation with US 10-Year Yields. Therefore, watching US 10-Year Yields and USD/JPY could give a clue as to the next direction for mortgage rates.
Learn more about forex trading opportunities.
Latest market news




The complete CFD trading experience
Award-winning platforms, competitive spreads, low commissions and dedicated support.
We live and breathe the markets and are dedicated to helping traders realise their ambitions as we continue to set the industry bar.
Economic calendar
Web Trader platform
Our sophisticated web-based platform is packed with features.
Related articles
US Dollar, GBP/USD, USD/CAD, USD/CHF, Gold Weekly Technical Outlook 11 2 2026
Sr. Technical Strategist Michael Boutros highlights the levels that matter on the USD Majors, commodities, and equity indices charts this week.
US Midterm Forecast: The Key Risks for Traders to Watch Through the US Elections
Prediction markets are pricing in nearly 75% odds of a Democratic sweep in this week’s US midterm elections, a development that would result in a split from the single party Republican rule of the past two years - what will it mean for markets?

GBP/USD outlook: Currency Pair of the Week | November 2, 2026
The GBP/USD heads into a crowded week of event risk, with the midterm elections, a Bank of England rate decision and Friday's non-farm payrolls report all capable of moving markets sharply. The greenback remains fundamentally well supported by a hawkish Federal Reserve, but much of that is already priced in, while the renewed sell-off in technology stocks has exposed its vulnerability.

StoneX Europe Ltd may make third party material available on this website which may contain information included but not limited to the conditions of financial markets. The material is for information purposes only and does not contain, and should not be construed as containing, investment advice and/or investment recommendation and/or an investment research and/or an offer of or solicitation for any transactions in financial instruments; any decision to enter into a specific transaction shall be made by the client following an assessment by him/her of their situation.
StoneX Europe Ltd makes no representation or warranty and assumes no liability as to the accuracy or completeness of the information provided, nor any loss arising from any investment based on a recommendation, forecast or other information supplied. You should always seek independent advice as to your suitability to speculate in any related markets and your ability to assume the associated risks, if you are at all unsure. We are not under any obligation to update any such material. Any opinion made may be personal to the author and may not reflect the opinion of StoneX Europe Ltd.