



US ISM Manufacturing PMI data should delight the Fed!
Today’s US ISM Manufacturing PMI for August shows that the US is on solid ground. As a result, the US Dollar Index made new 20-year highs.
Share this:

The Fed should feel ecstatic about the August ISM Manufacturing data released earlier today. The headline print was 52.8 vs an expectation of 52 and a July reading of 52.8. However, it is the individual components of the headline print that should please the Fed! The New Orders components was 51.3 vs 48 in July. The Employment Component was 54.2 vs 49.9 in July. Finally, the Price component was 52.5 vs 60 in July! Higher new orders, higher jobs, lower inflation. What else could the Fed ask for? If tomorrow’s Non-Farm Payroll print is stronger than the +300,000 expected, the Fed may feel confident in hiking 75bps when it meets later in the month. Fed members have been on the wires over the last few weeks speaking to the possibility of a 75bps hike, including Fed Chairman Powell at the Jackson Hole Symposium. The Fed has said its #1 priority is to bring down inflation, and today’s data gives the Fed hope that it can achieve that goal.
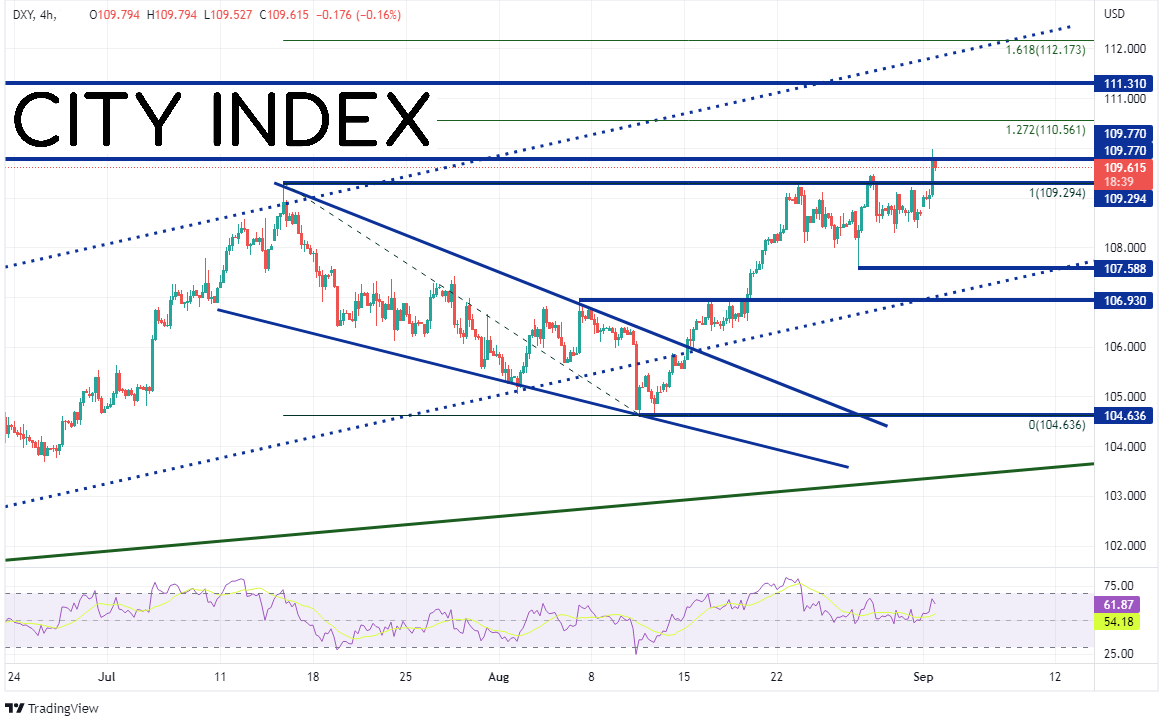
The US Dollar Index (DXY) had been in a rising channel since May 2021 (green channel). However, it became apparent inflation was moving higher and the Fed would have to raise rates. On April 21st, 2022, the DXY moved above the yearlong channel near 100.00 and began to form an even steeper channel. On July 14th, the US Dollar Index reached its highest level in 20 years at 109.29. Price then pulled back in a descending wedge pattern and created a morning star formation at horizontal support near 104.79. The DXY rallied from there and broke above the top, descending trendline from the wedge. Today, the US Dollar broke above the July 14th high, reaching its highest level since June 2002 at 109.98.

Source: Tradingview, Stone X
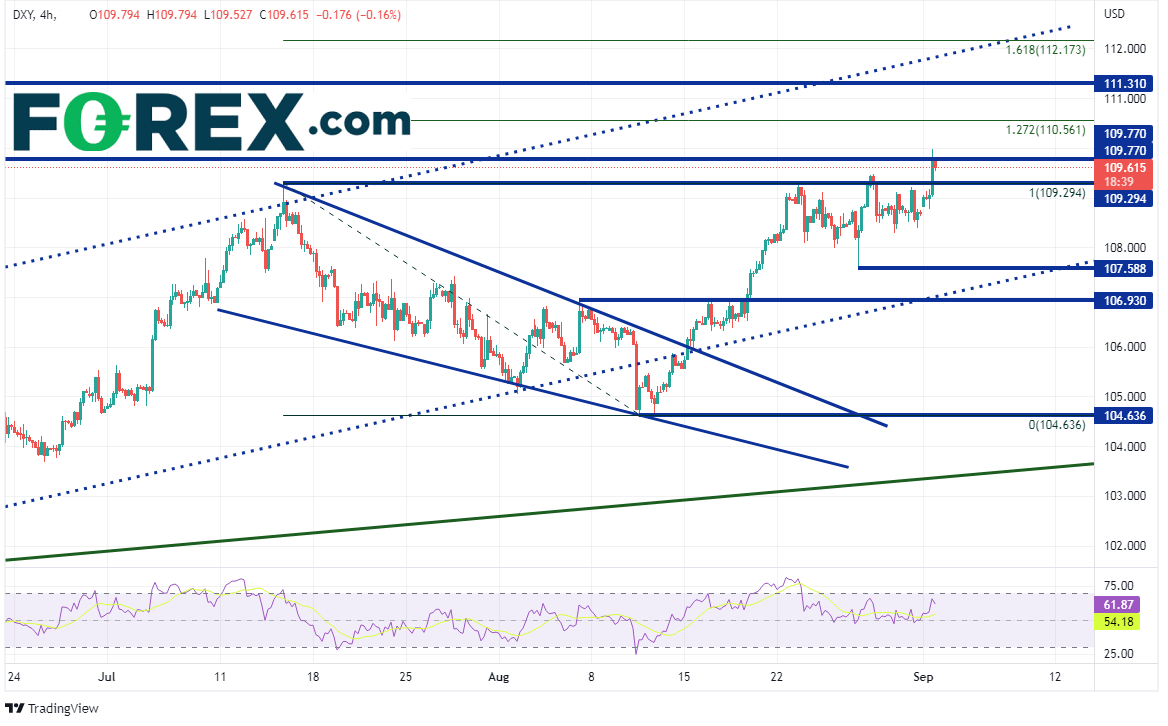
On a 240-minute timeframe, not only did the DXY take out the highs from July 14th (price actually took out that level by a few pips on August 29th), but it also traded above previous highs from September 2002. If the DXY continues to move higher, resistance is at the 127.2% Fibonacci extension from the highs of July 14th to the lows of August 10th, near 110.56. Above there price can move to resistance from September 2001 at 111.31 and then the top, upward sloping trendline of the recent channel near 111.85. However, if the DXY moves lower, first support is at the lows from August 26th at 107.59. Below there, price can fall to a confluence of support at horizontal support and the bottom upward sloping trendline of the more recent channel near 106.93. The next support level isn’t until the lows from August 10th at 106.93.
Source: Tradingview, Stone X
Today’s US ISM Manufacturing PMI for August shows that the US is on solid ground. As a result, the US Dollar Index made new 20-year highs. However, the PMI is only one data point in an economy with dozens of indicators the Fed uses to make its interest rate decision. Will the DXY continue to move higher? It may depend on the outcome of August’s Non-Farm Payroll data which will be released tomorrow! See our complete Non-Farm Preview here.
The Fed should feel ecstatic about the August ISM Manufacturing data released earlier today. The headline print was 52.8 vs an expectation of 52 and a July reading of 52.8. However, it is the individual components of the headline print that should please the Fed! The New Orders components was 51.3 vs 48 in July. The Employment Component was 54.2 vs 49.9 in July. Finally, the Price component was 52.5 vs 60 in July! Higher new orders, higher jobs, lower inflation. What else could the Fed ask for? If tomorrow’s Non-Farm Payroll print is stronger than the +300,000 expected, the Fed may feel confident in hiking 75bps when it meets later in the month. Fed members have been on the wires over the last few weeks speaking to the possibility of a 75bps hike, including Fed Chairman Powell at the Jackson Hole Symposium. The Fed has said its #1 priority is to bring down inflation, and today’s data gives the Fed hope that it can achieve that goal.
How do interest rates impact financial markets?
The US Dollar Index (DXY) had been in a rising channel since May 2021 (green channel). However, it became apparent inflation was moving higher and the Fed would have to raise rates. On April 21st, 2022, the DXY moved above the yearlong channel near 100.00 and began to form an even steeper channel. On July 14th, the US Dollar Index reached its highest level in 20 years at 109.29. Price then pulled back in a descending wedge pattern and created a morning star formation at horizontal support near 104.79. The DXY rallied from there and broke above the top, descending trendline from the wedge. Today, the US Dollar broke above the July 14th high, reaching its highest level since June 2002 at 109.98.

Source: Tradingview, Stone X
Trade the DXY now: Login or Open a new account!
• Open an account in the UK
• Open an account in Australia
• Open an account in Singapore
On a 240-minute timeframe, not only did the DXY take out the highs from July 14th (price actually took out that level by a few pips on August 29th), but it also traded above previous highs from September 2002. If the DXY continues to move higher, resistance is at the 127.2% Fibonacci extension from the highs of July 14th to the lows of August 10th, near 110.56. Above there price can move to resistance from September 2001 at 111.31 and then the top, upward sloping trendline of the recent channel near 111.85. However, if the DXY moves lower, first support is at the lows from August 26th at 107.59. Below there, price can fall to a confluence of support at horizontal support and the bottom upward sloping trendline of the more recent channel near 106.93. The next support level isn’t until the lows from August 10th at 106.93.
Source: Tradingview, Stone X
Today’s US ISM Manufacturing PMI for August shows that the US is on solid ground. As a result, the US Dollar Index made new 20-year highs. However, the PMI is only one data point in an economy with dozens of indicators the Fed uses to make its interest rate decision. Will the DXY continue to move higher? It may depend on the outcome of August’s Non-Farm Payroll data which will be released tomorrow! See our complete Non-Farm Preview here.
Learn more about forex trading opportunities.
Related tags:

The complete CFD trading experience
Award-winning platforms, competitive spreads, low commissions and dedicated support.
We live and breathe the markets and are dedicated to helping traders realise their ambitions as we continue to set the industry bar.
Economic calendar
Web Trader platform
Our sophisticated web-based platform is packed with features.
Related articles

USD/CAD forecast: rally could accelerate above June highs at 1.4250
USD/CAD recovered quickly after weaker US jobs data, keeping the bullish trend in focus. A move above the June highs could accelerate the rally as inflation keeps the Fed under pressure.


USD Sets Fresh Yearly High as EUR/USD Drops Dramatically, USD/JPY Stable
Well, it was a week of USD strength that wasn’t entirely pushed by USD/JPY, as a strong sell-off in EUR/USD has pushed the major pair to its most oversold state in a decade.


Dow Jones Slide Shows What Rate Hike Bets Mean for Stocks
The Dow Jones support breakdown shows rising bond yields and rate hike bets hitting U.S. stocks while tech giants prop up the Nasdaq.
StoneX Europe Ltd may make third party material available on this website which may contain information included but not limited to the conditions of financial markets. The material is for information purposes only and does not contain, and should not be construed as containing, investment advice and/or investment recommendation and/or an investment research and/or an offer of or solicitation for any transactions in financial instruments; any decision to enter into a specific transaction shall be made by the client following an assessment by him/her of their situation.
StoneX Europe Ltd makes no representation or warranty and assumes no liability as to the accuracy or completeness of the information provided, nor any loss arising from any investment based on a recommendation, forecast or other information supplied. You should always seek independent advice as to your suitability to speculate in any related markets and your ability to assume the associated risks, if you are at all unsure. We are not under any obligation to update any such material. Any opinion made may be personal to the author and may not reflect the opinion of StoneX Europe Ltd.