



US Yields and USD/JPY moving together; 6J confirms
If the correlation continues to be strong, watch for USD/JPY to continue to move with US 10-year yields
Share this:
As we wrote yesterday, US Yields and the US Dollar have been surging since the beginning of the new year. As a result, many of the US Dollar pairs, including EUR/USD have taken a hit. What about the traditional correlation markets tend to see, that between the Yen and yields? As of the time of this write, US 10-year yields are at their highest levels in 6 weeks near 1.68% and US 5-year yields are at their highest levels since February 2020, near 1.39%. Therefore, given the usual high negative correlation between yen and yields (positive correlation for yen pairs and yields), shouldn’t yen pairs by near highs?
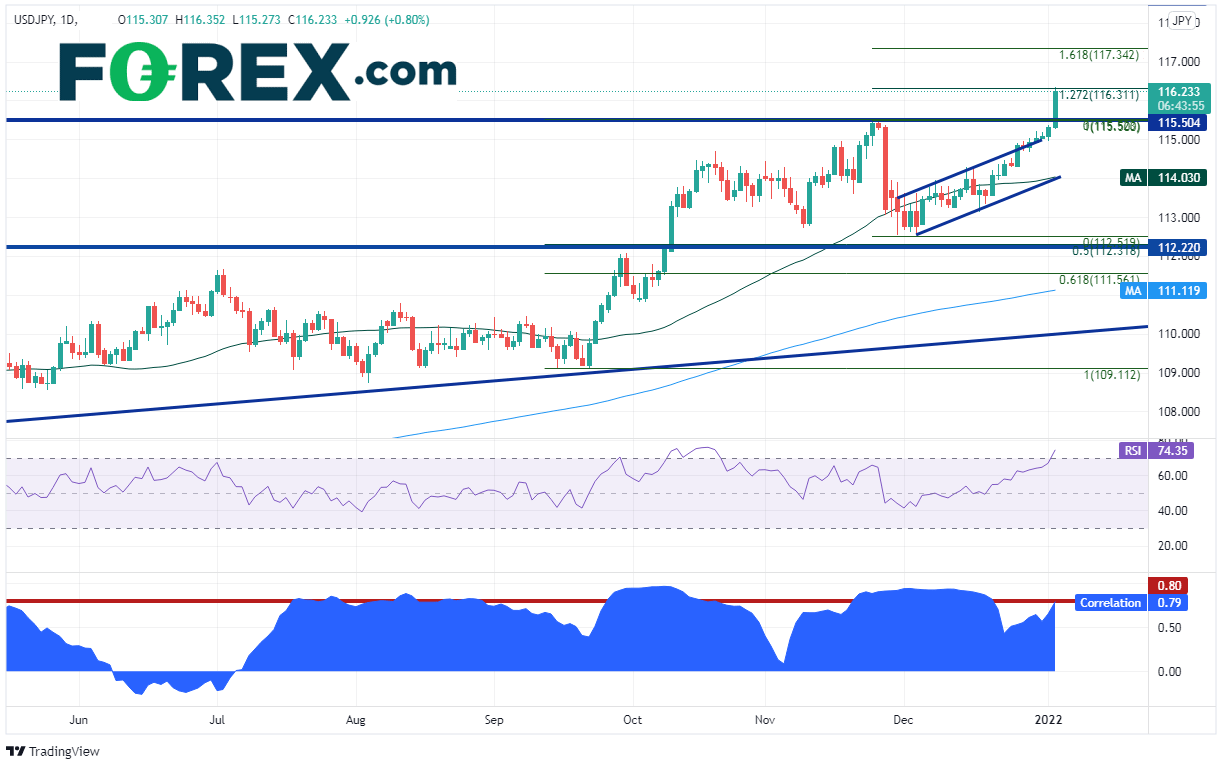
The correlation coefficient is the statistical measure of strength of the relationship used to compare two assets. The current correlation between USD/JPY and US 10-year yields is currently +0.79. Traders should look for correlations above +0.80 and below -0.80 for them to be considered significant. +0.79 is extremely close and bears watching. If yields continue to move higher, USD/JPY may move higher with it. The USD/JPY is currently trading near the 127.2% Fibonacci extension from the highs of November 24th, 2021 to the lows of November 30th, 2021, near 116.30. This is the highest level since January 2017. Resistance above is at the 161.8% Fibonacci extension from the same timeframe near 117.34 and then the highs of January 2017 at 118.66. Support below is at the previous highs of 115.52, then today’s lows at 115.27. Below there, USD/JPY could fall to the 50 Day Moving Average near 114.02. Notice that the RSI is in overbought territory which indicates prices may be ready for a pullback.
Source: Tradingview, Stone X
When there is a correlation coefficient that is on the borderline between being “significant” or not, it’s always best to check other sources for confirmation. For USD/JPY, one chart to look at is that of the Japanese Yen Futures, or 6J. Notice that the chart is the inverse of USD/JPY because it is in yen terms and not US Dollar terms. The correlation coefficient is -0.80, which is considered significant. Price tested the 127.2% Fibonacci extension from the November 24th lows to the November 30th highs, near 0.008602. The next level of support is at the 161.8% Fibonacci extension of the same timeframe, at 0.008524. Resistance is at the previous lows near 0.008657 and today’s highs of 0.008678.

Source: Tradingview, Stone X
The move in US yields over the last 2 days has taken USD/JPY along with it for the ride. The correlation coefficient on the daily timeframe is borderline as to whether it is significant. However, if traders look at the Yen futures contract, or 6J, they can see that the front month contract has already reached the -0.80 level, giving more confidence to the significance of the correlation between the US 10-year yields and the cash pair. If this relationship holds, watch for USD/JPY to continue to move with US 10-year yields!
As we wrote yesterday, US Yields and the US Dollar have been surging since the beginning of the new year. As a result, many of the US Dollar pairs, including EUR/USD have taken a hit. What about the traditional correlation markets tend to see, that between the Yen and yields? As of the time of this write, US 10-year yields are at their highest levels in 6 weeks near 1.68% and US 5-year yields are at their highest levels since February 2020, near 1.39%. Therefore, given the usual high negative correlation between yen and yields (positive correlation for yen pairs and yields), shouldn’t yen pairs by near highs?
Everything you should know about the Japanese Yen
The correlation coefficient is the statistical measure of strength of the relationship used to compare two assets. The current correlation between USD/JPY and US 10-year yields is currently +0.79. Traders should look for correlations above +0.80 and below -0.80 for them to be considered significant. +0.79 is extremely close and bears watching. If yields continue to move higher, USD/JPY may move higher with it. The USD/JPY is currently trading near the 127.2% Fibonacci extension from the highs of November 24th, 2021 to the lows of November 30th, 2021, near 116.30. This is the highest level since January 2017. Resistance above is at the 161.8% Fibonacci extension from the same timeframe near 117.34 and then the highs of January 2017 at 118.66. Support below is at the previous highs of 115.52, then today’s lows at 115.27. Below there, USD/JPY could fall to the 50 Day Moving Average near 114.02. Notice that the RSI is in overbought territory which indicates prices may be ready for a pullback.

Source: Tradingview, Stone X
When there is a correlation coefficient that is on the borderline between being “significant” or not, it’s always best to check other sources for confirmation. For USD/JPY, one chart to look at is that of the Japanese Yen Futures, or 6J. Notice that the chart is the inverse of USD/JPY because it is in yen terms and not US Dollar terms. The correlation coefficient is -0.80, which is considered significant. Price tested the 127.2% Fibonacci extension from the November 24th lows to the November 30th highs, near 0.008602. The next level of support is at the 161.8% Fibonacci extension of the same timeframe, at 0.008524. Resistance is at the previous lows near 0.008657 and today’s highs of 0.008678.

Source: Tradingview, Stone X
The move in US yields over the last 2 days has taken USD/JPY along with it for the ride. The correlation coefficient on the daily timeframe is borderline as to whether it is significant. However, if traders look at the Yen futures contract, or 6J, they can see that the front month contract has already reached the -0.80 level, giving more confidence to the significance of the correlation between the US 10-year yields and the cash pair. If this relationship holds, watch for USD/JPY to continue to move with US 10-year yields!
Learn more about forex trading opportunities.
Related tags:
Latest market news




The complete CFD trading experience
Award-winning platforms, competitive spreads, low commissions and dedicated support.
We live and breathe the markets and are dedicated to helping traders realise their ambitions as we continue to set the industry bar.
Economic calendar
Web Trader platform
Our sophisticated web-based platform is packed with features.
Related articles
USD/JPY Weekly Outlook: Volatility Has Left the Building
The yen has ignored broad dollar weakness, falling Treasury yields and renewed market turbulence. Yet its relationship with US interest rates remains intact. So why is USD/JPY going absolutely nowhere fast?
Swiss Franc Forecast: USD/CHF Seven-Week Rally Reverses From Yearly Highs 10 16 2026
A sharp rejection from fresh highs has shifted momentum in favor of USD/CHF bears, raising the stakes for a critical support test.


Nasdaq 100 forecast: Tech stocks not out of woods yet
US index futures pushed higher in the first half of Friday’s session, taking cues from a strong performance from European equities. Both European and US equity futures extending yesterday’s impressive recovery after the sharp sell-off earlier in the week. But the lingering concerns around the AI investment cycle remain, while bond markets were easing lower again, lifting yields.

StoneX Europe Ltd may make third party material available on this website which may contain information included but not limited to the conditions of financial markets. The material is for information purposes only and does not contain, and should not be construed as containing, investment advice and/or investment recommendation and/or an investment research and/or an offer of or solicitation for any transactions in financial instruments; any decision to enter into a specific transaction shall be made by the client following an assessment by him/her of their situation.
StoneX Europe Ltd makes no representation or warranty and assumes no liability as to the accuracy or completeness of the information provided, nor any loss arising from any investment based on a recommendation, forecast or other information supplied. You should always seek independent advice as to your suitability to speculate in any related markets and your ability to assume the associated risks, if you are at all unsure. We are not under any obligation to update any such material. Any opinion made may be personal to the author and may not reflect the opinion of StoneX Europe Ltd.