






USD/CAD: Jobs Data Collision Could Cement Loonie’s Reversal
Key reversal in play for USD/CAD—Friday’s jobs reports could determine whether the Loonie’s comeback sticks.
Share this:

- US and Canadian jobs data could fuel fresh volatility in USD/CAD
- A weak US payrolls print may trigger a larger market reaction than a strong one
- Key reversal candle forming on the weeklies—momentum signals suggest downside risks
Summary
While most attention on Friday will be on the US non-farm payrolls report, those trading USD/CAD will also have to contend with Canada’s jobs report—a notoriously volatile release that could add fuel to what’s already been a wild week for the Loonie.
After surging to 22-year highs on Monday, USD/CAD has spent the rest of the week unwinding the move, putting the weekly candle on the verge of printing a key reversal. Given the significance of this technical level, that would signal near-term directional risks may be shifting to the downside.
Double Trouble for Loonie Traders’
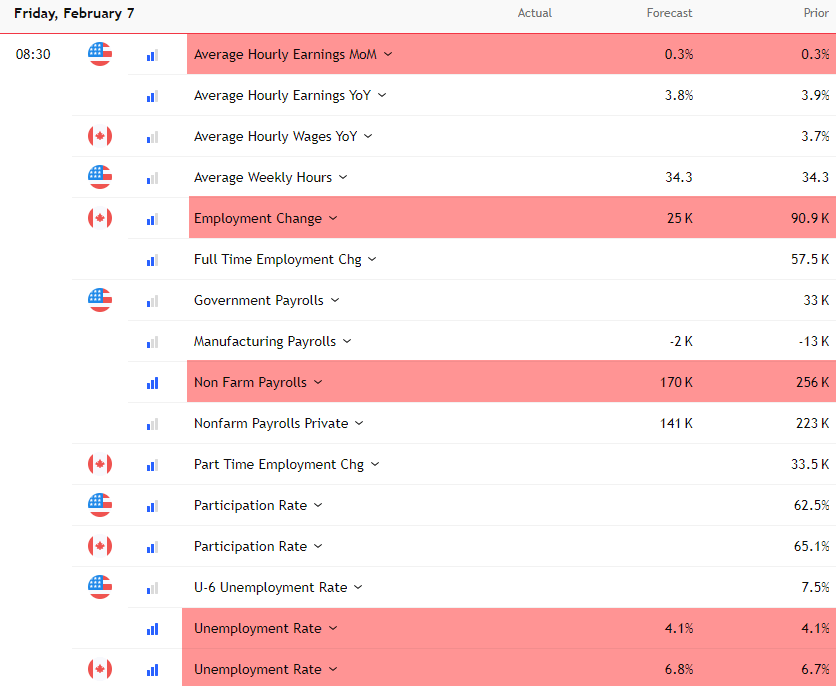
The key figures to watch in both reports are highlighted below. Apologies for the jumbled order—this is just how the data came through!
Source: TradingView
The unemployment rate is the key figure to watch. If we get wild swings in employment—which is a strong possibility relative to median forecasts—markets may ultimately focus on the unemployment signal. The US jobs report will likely take precedence over Canada’s unless the latter delivers a major surprise relative to expectations.
As discussed in a separate USD/JPY report, the significant hawkish repricing of Fed rate cut expectations since September—along with the Fed’s stance that further labour market weakness isn’t necessary to hit its 2% inflation target—means a weak jobs report could trigger a far bigger market reaction than a strong one.
Given the Canadian dollar’s poor performance against the US dollar recently, a strong Canadian jobs report could amplify any downside move in USD/CAD triggered by weak US payrolls.
USD/CAD Turning Point?
Technically, the reaction in USD/CAD will be crucial. It’s on track to print a key reversal candle on the weekly chart, having failed to hold above the January 2016 high earlier in the week.
Source: TradingView
A close at or below current levels would be a warning sign that near-term risks are tilting lower. Momentum indicators are reinforcing that message, with RSI (14) rolling over and MACD closing in on the signal line from above. After such a prolonged bullish run, the pair looks and feels heavy.
USD/CAD has tended to consolidate around big figures lately, so a break of 1.4262 would put 1.4200 and 1.4100 in focus. More meaningful support sits at 1.3978—the October 2022 high.
On the topside, the pair has struggled above 1.4500 over the past fortnight.
-- Written by David Scutt
Follow David on Twitter @scutty
How to trade with City Index
You can trade with City Index by following these four easy steps:
- Open an account, or log in if you’re already a customer
• Open an account in the UK
• Open an account in Australia
• Open an account in Singapore
- Search for the market you want to trade in our award-winning platform
- Choose your position and size, and your stop and limit levels
- Place the trade
Related tags:

The complete CFD trading experience
Award-winning platforms, competitive spreads, low commissions and dedicated support.
We live and breathe the markets and are dedicated to helping traders realise their ambitions as we continue to set the industry bar.
Economic calendar
Web Trader platform
Our sophisticated web-based platform is packed with features.
Related articles

USD/CAD forecast: rally could accelerate above June highs at 1.4250
USD/CAD recovered quickly after weaker US jobs data, keeping the bullish trend in focus. A move above the June highs could accelerate the rally as inflation keeps the Fed under pressure.


USD Sets Fresh Yearly High as EUR/USD Drops Dramatically, USD/JPY Stable
Well, it was a week of USD strength that wasn’t entirely pushed by USD/JPY, as a strong sell-off in EUR/USD has pushed the major pair to its most oversold state in a decade.


Dow Jones Slide Shows What Rate Hike Bets Mean for Stocks
The Dow Jones support breakdown shows rising bond yields and rate hike bets hitting U.S. stocks while tech giants prop up the Nasdaq.
StoneX Europe Ltd may make third party material available on this website which may contain information included but not limited to the conditions of financial markets. The material is for information purposes only and does not contain, and should not be construed as containing, investment advice and/or investment recommendation and/or an investment research and/or an offer of or solicitation for any transactions in financial instruments; any decision to enter into a specific transaction shall be made by the client following an assessment by him/her of their situation.
StoneX Europe Ltd makes no representation or warranty and assumes no liability as to the accuracy or completeness of the information provided, nor any loss arising from any investment based on a recommendation, forecast or other information supplied. You should always seek independent advice as to your suitability to speculate in any related markets and your ability to assume the associated risks, if you are at all unsure. We are not under any obligation to update any such material. Any opinion made may be personal to the author and may not reflect the opinion of StoneX Europe Ltd.