






USDNOK is Following Oil and the US Dollar
Why would USD/NOK come off as Crude was bottoming you ask?
Share this:

Yesterday, the Norwegian Health Minister, Bent Hoeie, said that the coronavirus is “under control” in Norway and that “a person carrying the novel coronavirus in Norway contaminates now on average 0.7 other individuals.” Before lockdown restrictions were implemented, the average was 2.5 to other individuals. Good news for the Norwegian Krone, however this isn’t the only reason it has been so strong as of late.
The USD/NOK is inversely correlated with the price of oil, as Norway is an oil export led economy. As we have seen over the course of the last month, the price of crude has been selling off aggressively since March 9th. Only recently has price began to bounce as Russia and OPEC+ have agreed to meet to discuss oil production cutbacks.
Source: Tradingview, City Index
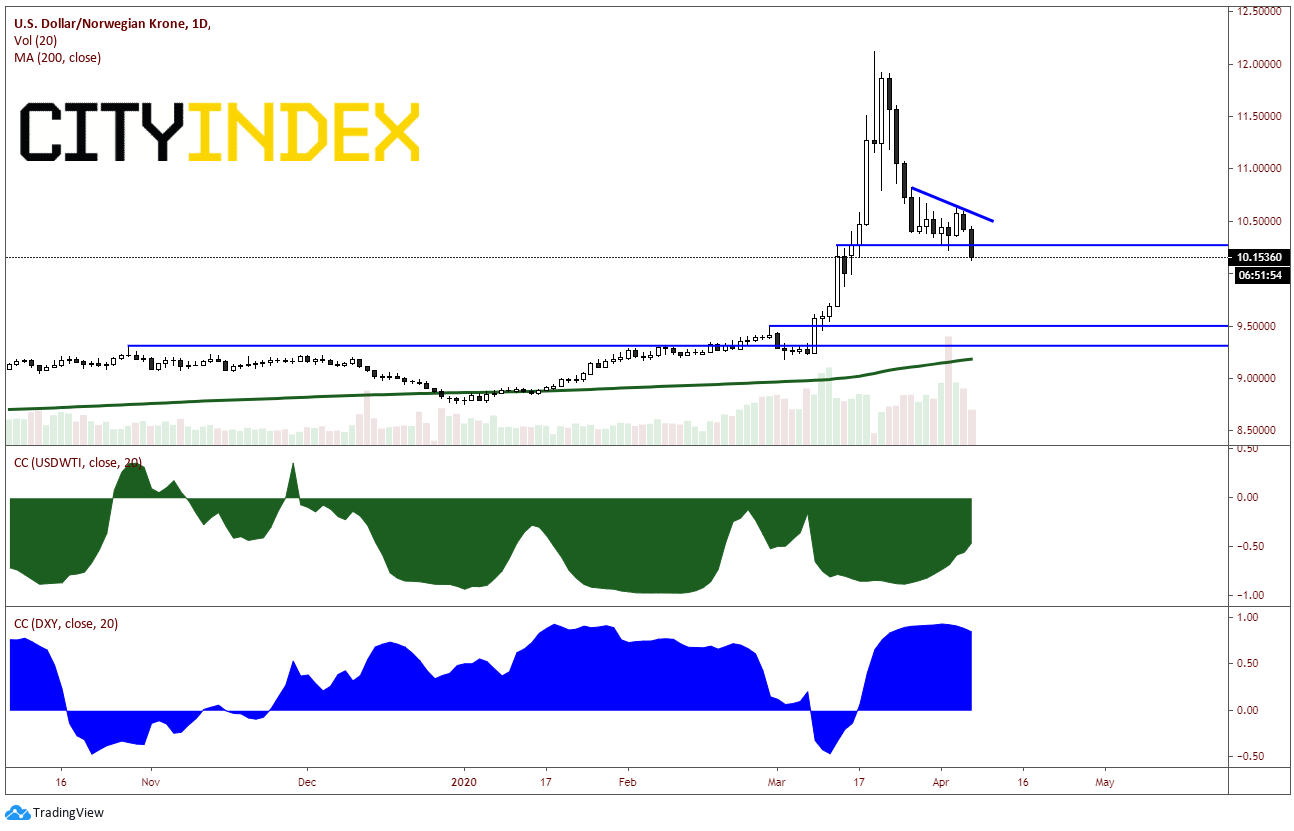
As crude oil began selling off on March 9th, USD/NOK had gone bid from then until March 19th from 9.2412 up to 12.1224. However, as crude oil continued to sell off an additional 10% and began forming a near term bottom, USD/NOK sold off as well and consolidated at the 61.8% Fibonacci retracement level off over the same time period near 10.33695. Between March 27th and yesterday, the pair tried to meagerly bounce, only to push lower today through the 61.8% level and horizontal support.
Why would USD/NOK come off as Crude was bottoming you ask? Because USD/NOK also has a strong positive correlation with DXY. As the DXY began pulling back on March 23rd, USD/NOK followed it lower. The bottom of the chart below shows the correlation coefficients for USD/NOK with both the WTI (green) and DXY(blue). Notice how on the move higher in USD/NOK, the correlation was more correlated with WTI (negatively). On its move lower, USD/NOK was more correlated with DXY (positively).
Source: Tradingview, City Index
If Crude Oil does bounce above the 30 level, USD/NOK could move back above the 61.8% retracement level and trendline resistance near 10.56. However, it appears for the time being, the pair is following DXY. If price closes today below support at 10.27, the next support isn’t until 9.6056 and then 9.4935. WTI crude oil will move on headlines relating to the upcoming meeting between OPEC and Russia.
Pay close attention to both the headlines and the correlations. These will indicate which direction USD/NOK will move next!
Yesterday, the Norwegian Health Minister, Bent Hoeie, said that the coronavirus is “under control” in Norway and that “a person carrying the novel coronavirus in Norway contaminates now on average 0.7 other individuals.” Before lockdown restrictions were implemented, the average was 2.5 to other individuals. Good news for the Norwegian Krone, however this isn’t the only reason it has been so strong as of late.
The USD/NOK is inversely correlated with the price of oil, as Norway is an oil export led economy. As we have seen over the course of the last month, the price of crude has been selling off aggressively since March 9th. Only recently has price began to bounce as Russia and OPEC+ have agreed to meet to discuss oil production cutbacks.
Source: Tradingview, FOREX.com
As crude oil began selling off on March 9th, USD/NOK had gone bid from then until March 19th from 9.2412 up to 12.1224. However, as crude oil continued to sell off an additional 10% and began forming a near term bottom, USD/NOK sold off as well and consolidated at the 61.8% Fibonacci retracement level off over the same time period near 10.33695. Between March 27th and yesterday, the pair tried to meagerly bounce, only to push lower today through the 61.8% level and horizontal support.
Why would USD/NOK come off as Crude was bottoming you ask? Because USD/NOK also has a strong positive correlation with DXY. As the DXY began pulling back on March 23rd, USD/NOK followed it lower. The bottom of the chart below shows the correlation coefficients for USD/NOK with both the WTI (green) and DXY(blue). Notice how on the move higher in USD/NOK, the correlation was more correlated with WTI (negatively). On its move lower, USD/NOK was more correlated with DXY (positively).
Source: Tradingview, FOREX.com
If Crude Oil does bounce above the 30 level, USD/NOK could move back above the 61.8% retracement level and trendline resistance near 10.56. However, it appears for the time being, the pair is following DXY. If price closes today below support at 10.27, the next support isn’t until 9.6056 and then 9.4935. WTI crude oil will move on headlines relating to the upcoming meeting between OPEC and Russia.
Pay close attention to both the headlines and the correlations. These will indicate which direction USD/NOK will move next!
Latest market news




The complete CFD trading experience
Award-winning platforms, competitive spreads, low commissions and dedicated support.
We live and breathe the markets and are dedicated to helping traders realise their ambitions as we continue to set the industry bar.
Economic calendar
Web Trader platform
Our sophisticated web-based platform is packed with features.
Related articles
Canadian Dollar Analysis: USD/CAD Returns to July Highs Ahead of NFP
The Canadian dollar continues to face one of its most challenging environments in recent months when it comes to maintaining strength against the U.S. dollar. The weakness of the Canadian currency is clearly reflected in USD/CAD, which has now recorded nine consecutive bullish sessions and gained more than 1.7% during that period.
US Dollar Technical Outlook: DXY Bulls Meet Resistance at Yearly Highs 10 1 2026
The U.S. Dollar has held firm despite fading Fed hike bets, but Friday’s payrolls could test the rally’s staying power.


AUD/USD hammered by US yields and fading RBA hike bets
US yields, dollar strength and fading RBA hike bets have combined to drive AUD/USD to fresh multi-month lows. The macro and technical bias remains bearish, although history suggests parts of the move are now reaching unusually stretched levels.

StoneX Europe Ltd may make third party material available on this website which may contain information included but not limited to the conditions of financial markets. The material is for information purposes only and does not contain, and should not be construed as containing, investment advice and/or investment recommendation and/or an investment research and/or an offer of or solicitation for any transactions in financial instruments; any decision to enter into a specific transaction shall be made by the client following an assessment by him/her of their situation.
StoneX Europe Ltd makes no representation or warranty and assumes no liability as to the accuracy or completeness of the information provided, nor any loss arising from any investment based on a recommendation, forecast or other information supplied. You should always seek independent advice as to your suitability to speculate in any related markets and your ability to assume the associated risks, if you are at all unsure. We are not under any obligation to update any such material. Any opinion made may be personal to the author and may not reflect the opinion of StoneX Europe Ltd.