






WTI crude oil headed for $90? Yields perk up: European open – 5/9/2023
The US yield curve has continued to creep higher after the 3-day weekend in the US, heling the US dollar retain its place at the top spot among currency majors. Yet WTI crude oil is managing to outpace the dollar, and looks set for at least another attempt to test the $90 level.
Share this:

Asian Indices:
- Australia's ASX 200 index fell by -23.1 points (-0.32%) and currently trades at 7,295.70
- Japan's Nikkei 225 index has risen by 228.56 points (0.7%) and currently trades at 32,939.18
- Hong Kong's Hang Seng index has fallen by -284.24 points (-1.51%) and currently trades at 18,559.92
- China's A50 Index has fallen by -90.1 points (-0.7%) and currently trades at 12,839.68
UK and Europe:
- UK's FTSE 100 futures are currently down -19.5 points (-0.26%), the cash market is currently estimated to open at 7,433.26
- Euro STOXX 50 futures are currently down -6 points (-0.14%), the cash market is currently estimated to open at 4,273.87
- Germany's DAX futures are currently down -26 points (-0.16%), the cash market is currently estimated to open at 15,798.85
US Futures:
- DJI futures are currently down -60 points (-0.17%)
- S&P 500 futures are currently down -7 points (-0.15%)
- Nasdaq 100 futures are currently down -14.25 points (-0.09%)
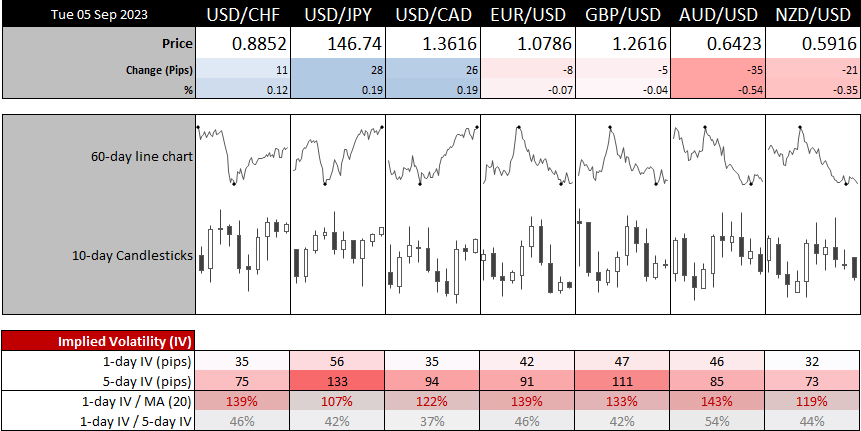
- US bond yields continued to move higher on Monday, helping support the USD which was the strongest forex major during Asian trade
- China’s services sector expanded at a much slower pace than expected, hitting a YTD low of 51.8 compared with 53.6% estimated and 54.1 prior
- This means that both the private Caixin and ‘official’ NBS surveys are continuing to slow, although weak news from China is not a new concept so questionable as to how much if a surprise it really is. On the flip side, this is also deflationary for the rest of the world, at least to a degree.
- It was still enough to weigh on the Australian dollar ahead of the RBA meeting, making AUD/USD the weakest forex major of the Asian session.
- Australia’s current account surplus narrowed to lower export prices, although strong trade volumes are still expected to support Wednesday’s GDP report, with net export contributions rising to 0.8% (-0.2% prior)
Events in focus (GMT+1):
- 08:00 – ECB President Lagarde speaks
- 09:00 – Eurozone composite, services PMIs
- 09:30 – UK composite, services PMIs
- 10:00 – Eurozone PPI
- 13:30 - ECB's Schnabel Speaks
- 15:00 – US durable orders
WTI crude oil technical analysis (daily chart):
WTI crude oil futures prices gapped higher after the 3-day weekend in the US. The gap has been filled and prices are now considering a break to new highs, although the sceptic within me always prefer to seek dips over chasing a move higher. But when you consider that oil prices have rallied despite a stronger US dollar over the last few days, then it is a real testament to demand for oil prices at present.
The daily chart shows a strong impulse move higher, which is seemingly within wave 5 which began with a bounce from the 50 and 200-day EMAs. The 61.8% Fibonacci projections from wave 1 and 2 to wave 3 sit either side of $90, which is a level the market is seemingly aiming for at present. That leaves the question as to whether the market will simply rip higher, or produce a pullback. If it moves higher, I would prefer to move to intraday timeframes and seek continuation pattern. If prices retrace, bullish could look for evidence of a swing low above the Jan/April highs or the $584 handle.
US 10-year yield technical analysis (daily chart):
The US yield curve continued to strengthen today, despite the market’s renewed conviction that the Fed will hold rates this month and they are done with tightening. I’ve noticed an interesting pattern on the US10-year yield which could also point to further gains. Since April, bullish engulfing candles which formed after a pullback or period of consolidation are yet to have their lows test, and they have marked textbook swing lows. Admittedly there are one or two among then that do not fit the full definition of a true engulfing candle (as an open or close is a few ticks the wrong side) but I’m happy to relax the rule, as these candles show clear range expansion in the direction of the underlying trend. That aside, take note that Friday’s candle was a true bullish engulfing day, so if the pattern holds bulls may want to seek dips above Friday’s low and assume a run for (and potential break above) the cycle highs.
View the full economic calendar
View the full economic calendar
-- Written by Matt Simpson
Follow Matt on Twitter @cLeverEdge
How to trade with City Index
You can trade with City Index by following these four easy steps:
- Open an account, or log in if you’re already a customer
• Open an account in the UK
• Open an account in Australia
• Open an account in Singapore
- Search for the market you want to trade in our award-winning platform
- Choose your position and size, and your stop and limit levels
- Place the trade
Related tags:


The complete CFD trading experience
Award-winning platforms, competitive spreads, low commissions and dedicated support.
We live and breathe the markets and are dedicated to helping traders realise their ambitions as we continue to set the industry bar.
Economic calendar
Web Trader platform
Our sophisticated web-based platform is packed with features.
Related articles

Gold Update: XAU/USD Remains Under Pressure Even After the NFP Report
As the trading week comes to an end, weakness around gold price action remains evident in the short term. This can be seen in the performance of the past two sessions, where the metal has declined by approximately 0.3%. Although the move has not been particularly aggressive, it highlights that buying pressure continues to struggle to regain control of the market.


USD/CAD forecast: rally could accelerate above June highs at 1.4250
USD/CAD recovered quickly after weaker US jobs data, keeping the bullish trend in focus. A move above the June highs could accelerate the rally as inflation keeps the Fed under pressure.


Dow Jones Slide Shows What Rate Hike Bets Mean for Stocks
The Dow Jones support breakdown shows rising bond yields and rate hike bets hitting U.S. stocks while tech giants prop up the Nasdaq.
StoneX Europe Ltd may make third party material available on this website which may contain information included but not limited to the conditions of financial markets. The material is for information purposes only and does not contain, and should not be construed as containing, investment advice and/or investment recommendation and/or an investment research and/or an offer of or solicitation for any transactions in financial instruments; any decision to enter into a specific transaction shall be made by the client following an assessment by him/her of their situation.
StoneX Europe Ltd makes no representation or warranty and assumes no liability as to the accuracy or completeness of the information provided, nor any loss arising from any investment based on a recommendation, forecast or other information supplied. You should always seek independent advice as to your suitability to speculate in any related markets and your ability to assume the associated risks, if you are at all unsure. We are not under any obligation to update any such material. Any opinion made may be personal to the author and may not reflect the opinion of StoneX Europe Ltd.