


ASX 200 Market Outlook: 9000 Becomes Key Battleground
The ASX 200 edged higher in thin trade, but 9000 has emerged as the key battleground as options positioning caps upside momentum.
Share this:

The ASX 200 continues to grind higher, but momentum is slowing near cycle highs. With volumes subdued and options positioning clustered around 9000, traders face a clear decision point: breakout continuation or renewed downside pressure.
View related analysis:
- FX Futures Positioning: USD, EUR, GBP, CAD | COT report
- Japanese Yen Price Action Setups Across USD/JPY, GBP/JPY, EUR/JPY, CAD/JPY
- Australian Dollar Outlook: AUD/USD Rally Vulnerable to Chop at the Top
- Nasdaq 100 Leads Risk-Off as Tech Earnings Weigh, Gold Slides
- ASX 200 Market Outlook: CBA Surges, CSL Plunges as Earnings Diverge
View related analysis:
- FX Futures Positioning: USD, EUR, GBP, CAD | COT report
- Japanese Yen Price Action Setups Across USD/JPY, GBP/JPY, EUR/JPY, CAD/JPY
- Australian Dollar Outlook: AUD/USD Rally Vulnerable to Chop at the Top
- Nasdaq 100 Leads Risk-Off as Tech Earnings Weigh, Gold Slides
- ASX 200 Market Outlook: CBA Surges, CSL Plunges as Earnings Diverge
ASX 200 Market Snapshot
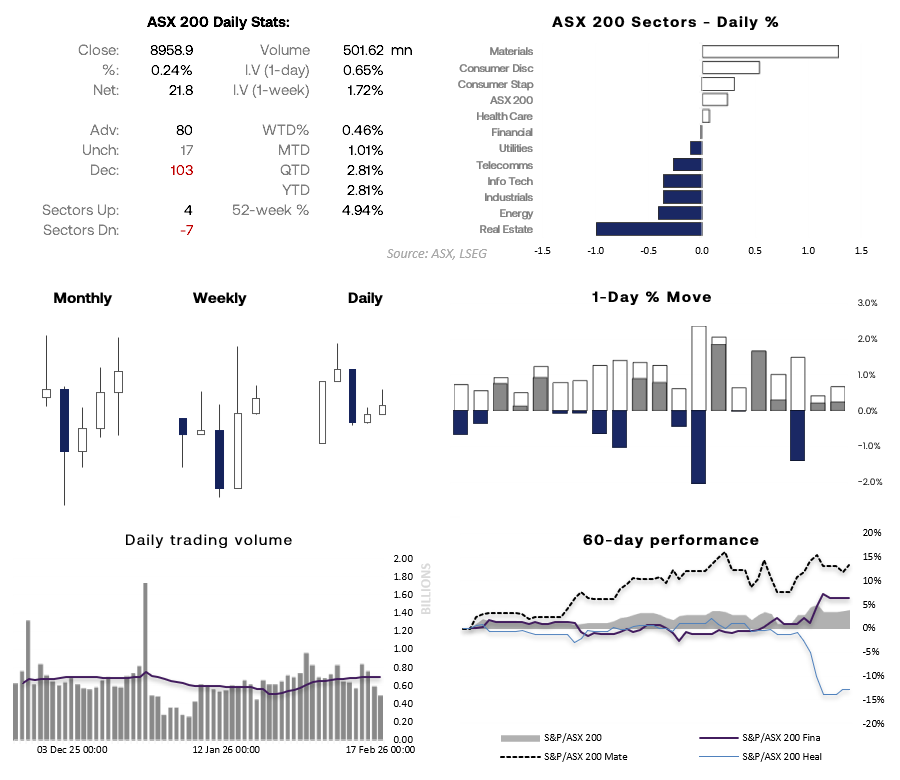
- The ASX 200 edged higher for a second consecutive session amid low-liquidity trade, with daily volumes declining again and remaining well below average.
- A higher wick formed on the ASX 200 cash chart, leaving a small shooting star candle by Tuesday’s close – hinting at a potential near-term swing high.
- A risk-off tone filtered through Asian indices, while Wall Street futures softened and the Japanese yen strengthened ahead of key US–Iran talks later in the day.
- Wednesday has delivered the lowest average daily range over the past 15 months. However, that pattern could be disrupted if geopolitical risks intensify following US–Iran talks and liquidity returns after the US long weekend.
- Sector performance was mixed. Materials (XMJ) and consumer discretionary (XDJ) led five sectors higher, while real estate (XRE) and energy (XEJ) weighed on the six sectors that closed lower.
Source: ASX, LSEG
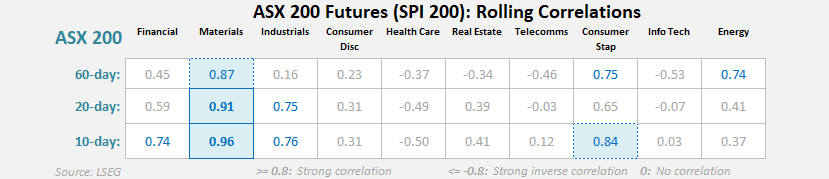
ASX 200 Correlations / Sector Analysis
Source: ASX, LSEG
ASX 200 (XJO) Options Analysis
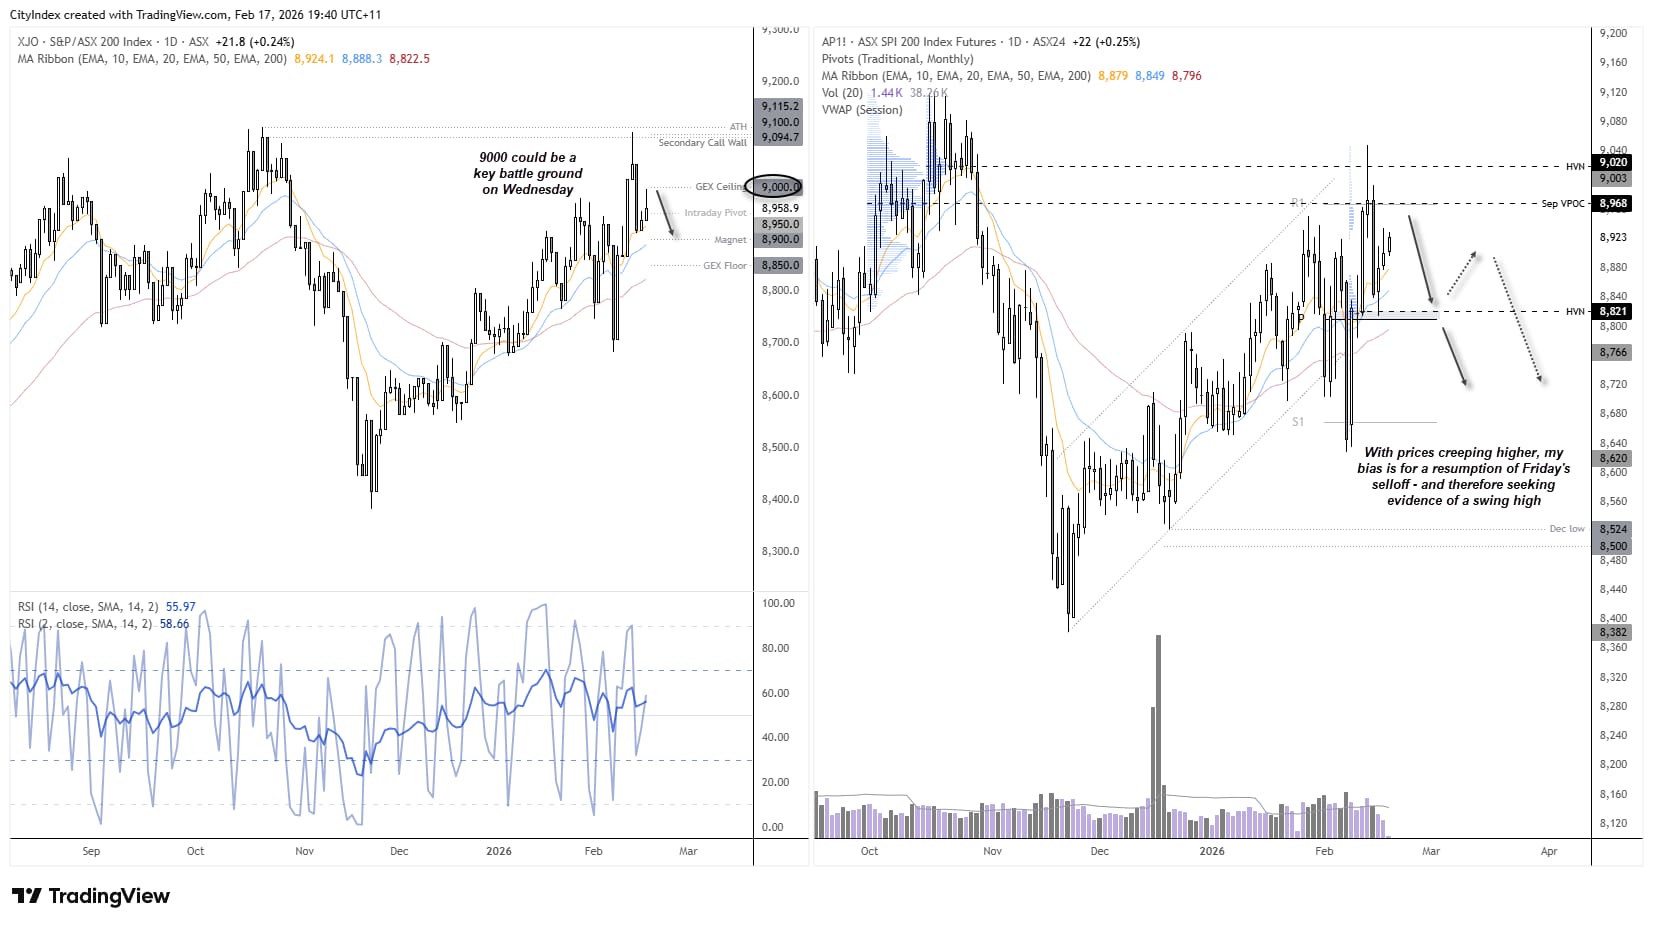
Options positioning suggests the ASX 200 cash market (left) may remain rangebound unless we see a decisive breakout.
The 9000 level stands out as the primary upside barrier, with a large concentration of call options clustered there. That could limit gains unless buyers can establish acceptance above it.
On the downside, 8850 appears to provide solid support, with heavy put positioning likely to slow pullbacks into that zone. Between those two levels, 8900 may act as a short-term pivot where price could gravitate during quieter sessions.
In short, the ASX 200 looks boxed between 8850 and 9000 for now. A sustained break and hold above 9000 would expose a move toward 9050–9100, while a decisive move below 8900 could open the door for a retest of 8850.


SPI 200 (ASX 200) Futures Outlook
My bearish bias was invalidated on Wednesday by a clear bullish range expansion candle. While bulls attempted to push to a record high on the cash market on Thursday, prices reversed to leave a shooting star candle on both the cash index and futures. That one-bar reversal was followed by a distinctly bearish session on Friday.
With prices creeping higher again, it appears the market is testing resistance once more. The 9000 level remains pivotal for the cash index. I am now looking for signs of a resumption of Friday’s selloff, ideally with momentum pushing prices back below Friday’s low.
Source: ASX, TradingView
View the full economic calendar
View the full economic calendar
-- Written by Matt Simpson
Follow Matt on Twitter @cLeverEdge
How to trade with City Index
You can trade with City Index by following these four easy steps:
- Open an account, or log in if you’re already a customer
• Open an account in the UK
• Open an account in Australia
• Open an account in Singapore
- Search for the market you want to trade in our award-winning platform
- Choose your position and size, and your stop and limit levels
- Place the trade
Related tags:




Open an account in minutes
Experience award-winning platforms with fast and secure execution, and enjoy tight spreads from 0.5 pts on FX and 0.3 pts on indices.
Economic calendar
Web Trader platform
Our sophisticated web-based platform is packed with features.
Related articles
Australian Dollar Outlook: AUD/USD Screams Sentiment Extreme Into Fed, CPI
AUD/USD rebounds despite record bearish futures positioning, with Australian Q3 CPI and the Fed meeting threatening to trigger another short squeeze.

S&P 500 forecast: AI linked stocks remain under pressure
And just like that, it is Friday again and the end of a volatile week. Today offers little on the macro calendar to change the prevailing narrative, leaving markets largely at the mercy of risk appetite, oil prices and the growing unease around the AI trade.


USD/JPY, Nikkei Break Lower as AI Meltdown Spreads
Thursday’s tech tantrum has become Friday’s fire sale. With Nikkei support giving way and the yen strengthening, could the selling start feeding on itself?

This report is intended for general circulation only. It should not be construed as a recommendation, or an offer (or solicitation of an offer) to buy or sell any financial products. The information provided does not take into account your specific investment objectives, financial situation or particular needs. Before you act on any recommendation that may be contained in this report, independent advice ought to be sought from a financial adviser regarding the suitability of the investment product, taking into account your specific investment objectives, financial situation or particular needs.
StoneX Financial Pte. Ltd., may distribute reports produced by its respective foreign entities or affiliates within the StoneX group of companies or third parties pursuant to an arrangement under Regulation 32C of the Financial Advisers Regulations. Where the report is distributed to a person in Singapore who is not an accredited investor, expert investor or an institutional investor (as defined in the Securities Futures Act), StoneX Financial Pte. Ltd. accepts legal responsibility to such persons for the contents of the report only to the extent required by law. Singapore recipients should contact StoneX Financial Pte. Ltd. at 6826 9988 for matters arising from, or in connection with the report.
In the case of all other recipients of this report, to the extent permitted by applicable laws and regulations neither StoneX Financial Pte. Ltd. nor its associated companies will be responsible or liable for any loss or damage incurred arising out of, or in connection with, any use of the information contained in this report and all such liability is hereby expressly disclaimed. No representation or warranty is made, express or implied, that the content of this report is complete or accurate.
StoneX Financial Pte. Ltd. is not under any obligation to update this report.
Trading CFDs carries a high level of risk that may not be suitable for some investors. Consider your investment objectives, level of experience, financial resources, risk appetite and other relevant circumstances carefully. The possibility exists that you could lose some or all of your investments, including your initial deposits. If in doubt, please seek independent expert advice. Visit www.forex.com/en-sg/terms-and-policies for the complete Risk Disclosure Statement.