






Crude Oil the Economy and Volatility
Until the world can gain control of the coronavirus, the economic uncertainly will remain.
Share this:

With the selloff in May Crude Oil WTI futures yesterday, in which price traded as low as -$40.00, traders are asking what that really means as far as the world economy is concerned. As discussed yesterday, the move only reflected a small segment of the oil market. The May contract, which is currently trading near $0, expires today. This means that a majority of traders had already rolled their positions into the June contract. Yesterday’s capitulation on May Crude Oil WTI futures contract seemed to have little effect on other assets and asset classes, as the focus is now on the June contract.
Now let’s take a step back and think about the bigger picutre: In simplistic terms, NO ONE WANTED TO BUY CRUDE OIL AND RECEIVE $40 TO HOLD IT! Why? There is so much supply on the market already, there is literally nowhere to store it. However, yesterday, traders believed that in 1 month, there would be enough demand/less supply for the June contract to be worth $20.43. Today, traders are beginning to have doubts as the June contract is currently trading -25% under $15, with a low of $11.79.
Source: Tradingview, NYMEX, City Index
Until the world can gain control of the coronavirus, the economic uncertainly will remain. And, as long as there is economic uncertainty, crude prices are going to continue to be volatile. There are sure to be fits and starts along the way, as some countries will begin to “re-open” and then have to slow down.
If one is looking to trade the crude volatility, but doesn’t want risk of futures or ETFs, one of the best instruments to trade as a surrogate is USD/CAD. Canada is an oil export led economy. Therefore, the price of crude oil plays a large part in the price of the Canadian Dollar. Notice on a weekly timeframe that since the beginning of the year, WTI Crude Oil and USD/CAD have become increasingly negatively correlated. The current correlation coefficient between the two assets is -0.96. A reading of -1.00 indicates that the two move perfectly together in opposite directions. The current reading of -0.96 is pretty close!
Source: Tradingview, City Index
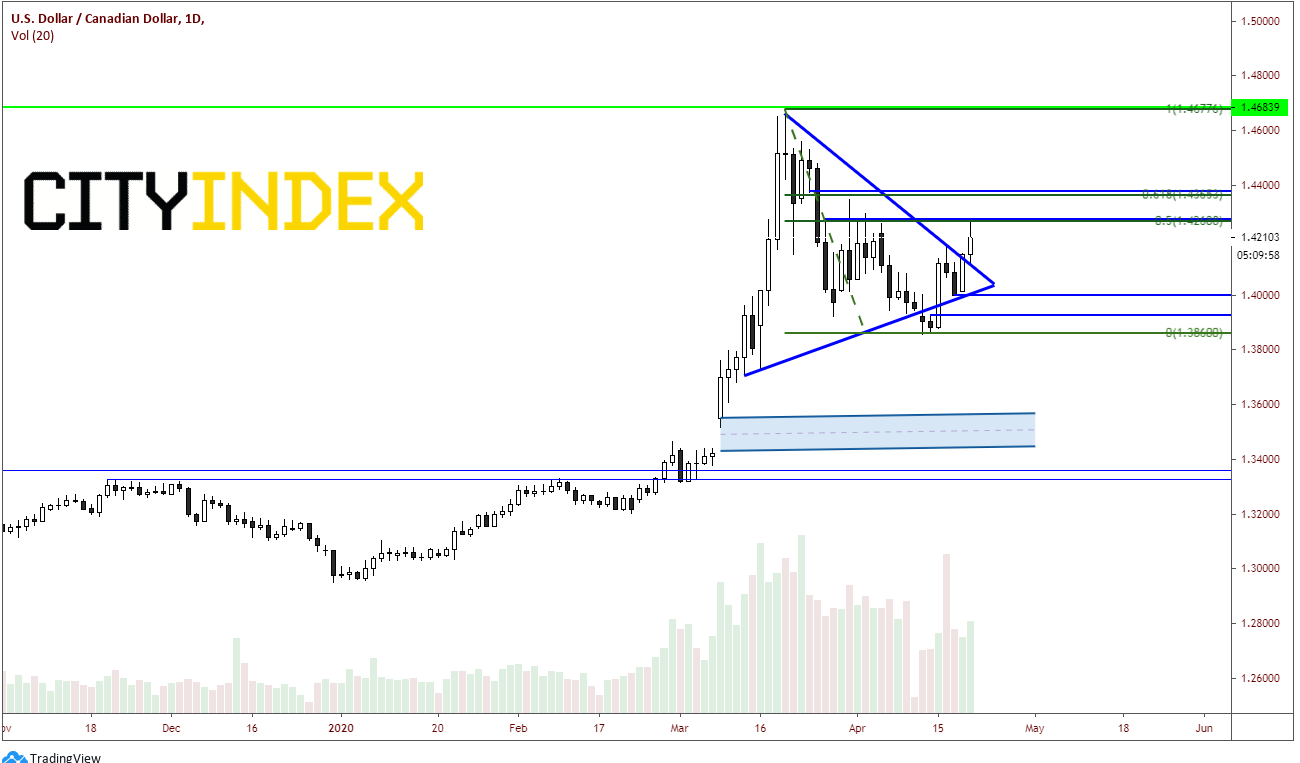
USD/CAD put in a low at the beginning of the year just below 1.3000. Since then, price has traded to 1.4667 on March 19th and has been consolidating in a pennant like formation since. The pair had a false breakdown out of the bottom of the pennant on April 13th and shot back into the formation on April 15th. With the move lower in Crude Oil yesterday, the pair broke higher out of the triangle and is continuing to move higher today.
Source: Tradingview, City Index
Resistance is currently near the highs of the day, which is horizontal resistance and the 50% retracement from the March 19th highs to the April 13th lows near 1.4265. The next level is horizontal resistance and the 61.8% Fibonacci retracement from the same time period. Above that, price can run up and test the March 19th highs near 1.4675. Support crosses at the downward sloping trendline for the pennant near 1.4100. Below that is horizontal support, trendline support, and psychological support at 1.4000. If price manages to break through there, horizontal support is at 1.3925.
Source: Tradingview, City Index
Crude oil futures are expensive and extremely volatile to trade. However, if one wishes to take advantage of these without actually trading crude, USD/CAD will provide many of the same directional benefits at a relatively cheaper price and with relatively less volatility.
With the selloff in May Crude Oil WTI futures yesterday, in which price traded as low as -$40.00, traders are asking what that really means as far as the world economy is concerned. As discussed yesterday, the move only reflected a small segment of the oil market. The May contract, which is currently trading near $0, expires today. This means that a majority of traders had already rolled their positions into the June contract. Yesterday’s capitulation on May Crude Oil WTI futures contract seemed to have little effect on other assets and asset classes, as the focus is now on the June contract.
Now let’s take a step back and think about the bigger picutre: In simplistic terms, NO ONE WANTED TO BUY CRUDE OIL AND RECEIVE $40 TO HOLD IT! Why? There is so much supply on the market already, there is literally nowhere to store it. However, yesterday, traders believed that in 1 month, there would be enough demand/less supply for the June contract to be worth $20.43. Today, traders are beginning to have doubts as the June contract is currently trading -25% under $15, with a low of $11.79.
Source: Tradingview, NYMEX, FOREX.com
Until the world can gain control of the coronavirus, the economic uncertainly will remain. And, as long as there is economic uncertainty, crude prices are going to continue to be volatile. There are sure to be fits and starts along the way, as some countries will begin to “re-open” and then have to slow down.
If one is looking to trade the crude volatility, but doesn’t want risk of futures or ETFs, one of the best instruments to trade as a surrogate is USD/CAD. Canada is an oil export led economy. Therefore, the price of crude oil plays a large part in the price of the Canadian Dollar. Notice on a weekly timeframe that since the beginning of the year, WTI Crude Oil and USD/CAD have become increasingly negatively correlated. The current correlation coefficient between the two assets is -0.96. A reading of -1.00 indicates that the two move perfectly together in opposite directions. The current reading of -0.96 is pretty close!
Source: Tradingview, FOREX.com
USD/CAD put in a low at the beginning of the year just below 1.3000. Since then, price has traded to 1.4667 on March 19th and has been consolidating in a pennant like formation since. The pair had a false breakdown out of the bottom of the pennant on April 13th and shot back into the formation on April 15th. With the move lower in Crude Oil yesterday, the pair broke higher out of the triangle and is continuing to move higher today.
Source: Tradingview, FOREX.com
Resistance is currently near the highs of the day, which is horizontal resistance and the 50% retracement from the March 19th highs to the April 13th lows near 1.4265. The next level is horizontal resistance and the 61.8% Fibonacci retracement from the same time period. Above that, price can run up and test the March 19th highs near 1.4675. Support crosses at the downward sloping trendline for the pennant near 1.4100. Below that is horizontal support, trendline support, and psychological support at 1.4000. If price manages to break through there, horizontal support is at 1.3925.
Source: Tradingview, FOREX.com
Crude oil futures are expensive and extremely volatile to trade. However, if one wishes to take advantage of these without actually trading crude, USD/CAD will provide many of the same directional benefits at a relatively cheaper price and with relatively less volatility.




Open an account in minutes
Experience award-winning platforms with fast and secure execution, and enjoy tight spreads from 0.5 pts on FX and 0.3 pts on indices.
Economic calendar
Web Trader platform
Our sophisticated web-based platform is packed with features.
Related articles

Crude Oil Analysis: Geopolitical Risk Continues to Drive the WTI Barrel Higher
During recent trading sessions, a new wave of buying momentum has continued to gain relevance around WTI crude oil price action. Over the last three trading sessions, the market has maintained a bullish streak and is now up more than 5.5%, highlighting significant buying pressure in the short term.


Crude Oil Forecast WTI Prices Come Under Pressure as Middle East Risks Ease
Over the last two trading sessions, WTI crude oil has once again displayed a notable bearish bias, with prices falling nearly 6%. Part of this renewed selling pressure has been driven by recent developments in the Middle East, which have helped temporarily ease the geopolitical tensions that had supported the oil risk premium in previous weeks.
Crude Oil Analysis WTI barrel remains weak after OPEC+ announcements
Crude oil continues to face difficult trading sessions in the short term. Over the last 5 trading sessions on average, WTI remains down close to -3.5%, with consistent movements below the 70-dollar area. This continues to highlight a selling bias that has remained in place for several weeks.
This report is intended for general circulation only. It should not be construed as a recommendation, or an offer (or solicitation of an offer) to buy or sell any financial products. The information provided does not take into account your specific investment objectives, financial situation or particular needs. Before you act on any recommendation that may be contained in this report, independent advice ought to be sought from a financial adviser regarding the suitability of the investment product, taking into account your specific investment objectives, financial situation or particular needs.
StoneX Financial Pte. Ltd., may distribute reports produced by its respective foreign entities or affiliates within the StoneX group of companies or third parties pursuant to an arrangement under Regulation 32C of the Financial Advisers Regulations. Where the report is distributed to a person in Singapore who is not an accredited investor, expert investor or an institutional investor (as defined in the Securities Futures Act), StoneX Financial Pte. Ltd. accepts legal responsibility to such persons for the contents of the report only to the extent required by law. Singapore recipients should contact StoneX Financial Pte. Ltd. at 6826 9988 for matters arising from, or in connection with the report.
In the case of all other recipients of this report, to the extent permitted by applicable laws and regulations neither StoneX Financial Pte. Ltd. nor its associated companies will be responsible or liable for any loss or damage incurred arising out of, or in connection with, any use of the information contained in this report and all such liability is hereby expressly disclaimed. No representation or warranty is made, express or implied, that the content of this report is complete or accurate.
StoneX Financial Pte. Ltd. is not under any obligation to update this report.
Trading CFDs carries a high level of risk that may not be suitable for some investors. Consider your investment objectives, level of experience, financial resources, risk appetite and other relevant circumstances carefully. The possibility exists that you could lose some or all of your investments, including your initial deposits. If in doubt, please seek independent expert advice. Visit www.forex.com/en-sg/terms-and-policies for the complete Risk Disclosure Statement.