


Nasdaq 100 Leads Wall Street Rebound, ASX and Nikkei in Focus
Nasdaq 100 leads a sharp Wall Street rebound as easing Iran tensions lift risk appetite, with ASX 200 and Nikkei poised to follow.
Share this:

Wall Street staged a sharp reversal to start the week, with the Nasdaq 100 leading a broad risk-on rebound as geopolitical tensions eased. With bearish momentum fading, attention now turns to whether the ASX 200 and Nikkei can follow through higher in today’s session.
View related analysis:
View related analysis:
Wall Street Rebound Led by Nasdaq 100 as ASX 200 and Nikkei Eye Gains
It was another volatile start to the week on Monday, though one that ended decisively risk-on this time around. President Trump’s latest TACO trade swung into action before the US open after he backed down from his threat to attack Iran’s oil infrastructure.
- Crude oil prices plunged over 14% in a matter of minutes upon the first real signs that the US had blinked.
- Wall Street indices quickly erased Friday’s losses with their bullish engulfing daily ranges sitting around 4%
- Gold recouped most of the day’s losses after initially plunging around 10% and rebounding from just above 4100
- Silver recovered back above Monday’s open though met resistance below $70 to mark its ninth daily decline from the prior close – its worst such run since April 2022


Wall Street Indices Stabilise as Selling Pressure Eases Amid Iran Conflict
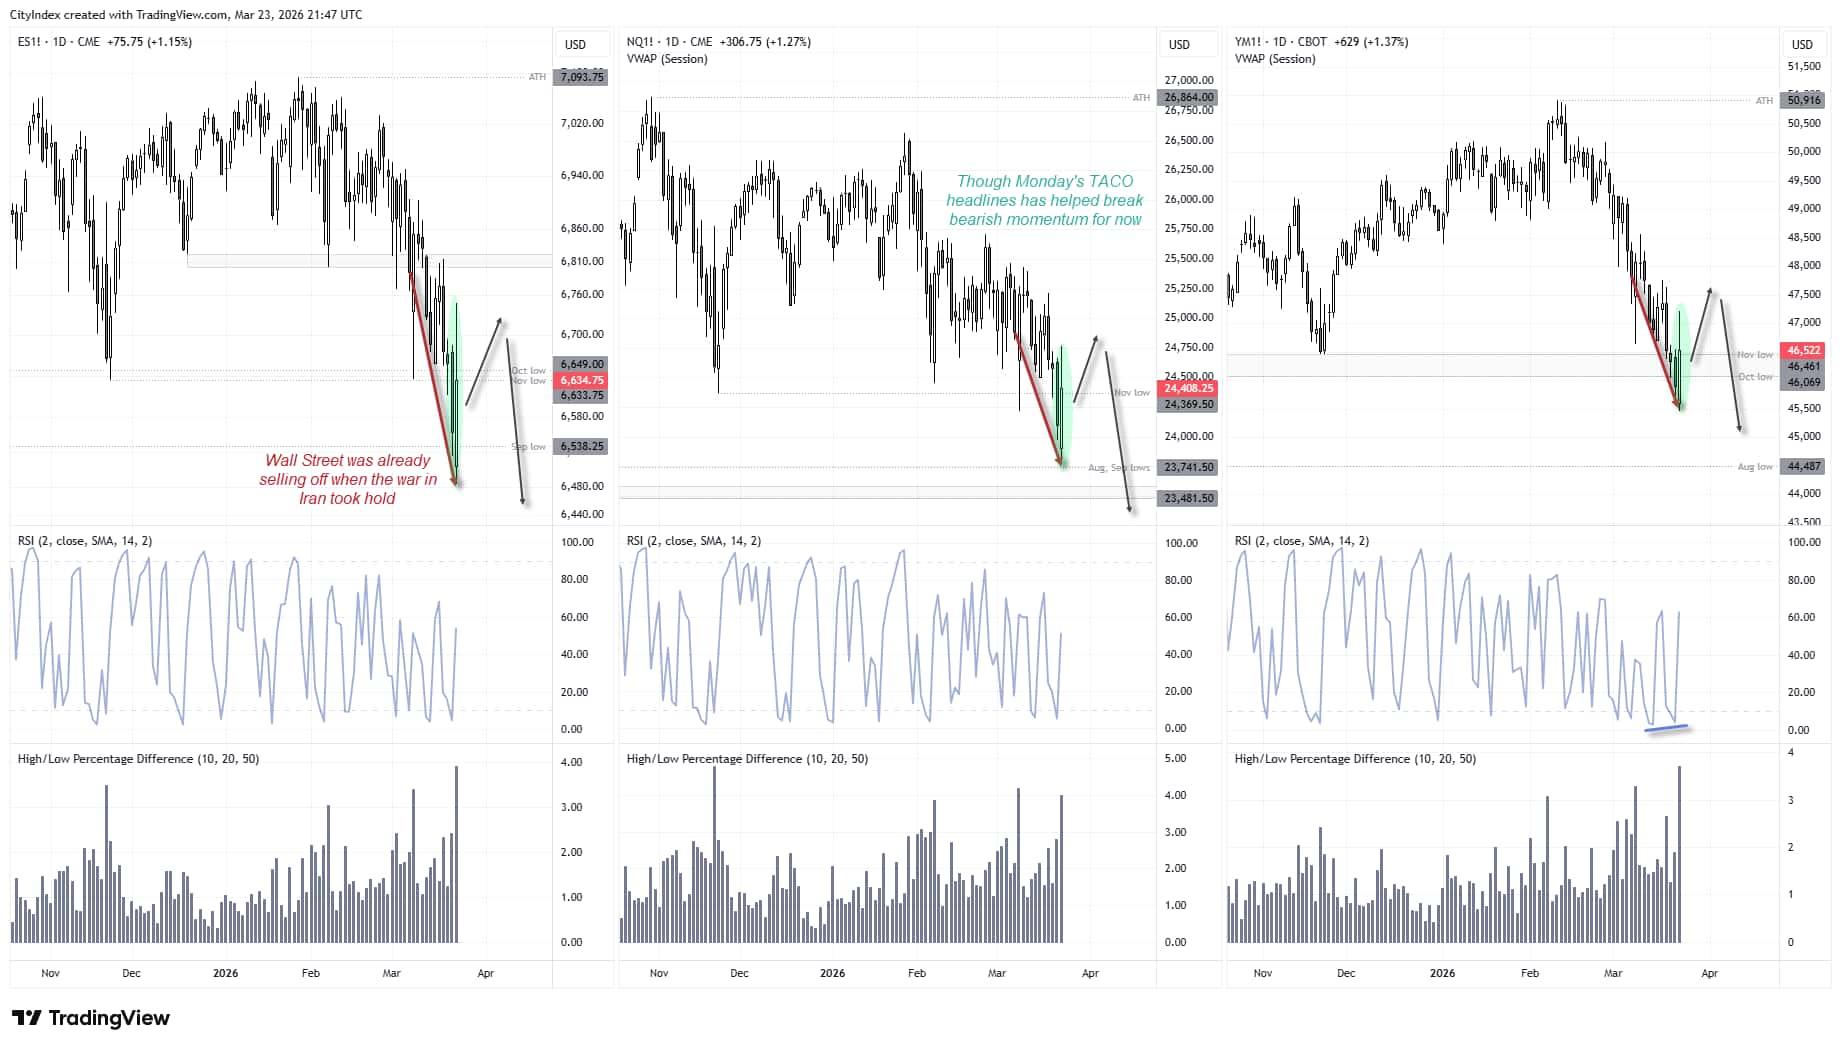
Wall Street indices had already fallen around 5% since the Friday prior to the escalation of the Iran conflict, although they were in a broader selling phase regardless. The Nasdaq has led declines overall, falling -11.5% from its record high, while the S&P 500 is down -8.6% and the Dow Jones -10.7%.
With no guarantee that Trump can end the conflict as quickly as it began, further downside risks remain for US equities, particularly as the war appears to account for roughly half of the current drawdown.
However, bearish momentum has clearly eased for now. All three indices are holding above key support levels and have printed bullish engulfing sessions with gains of around 4%, suggesting a near-term stabilisation.
And that could see a bullish follow-through in Asia today.
Source: CME, CBOT, TradingView
ASX 200 Technical Analysis
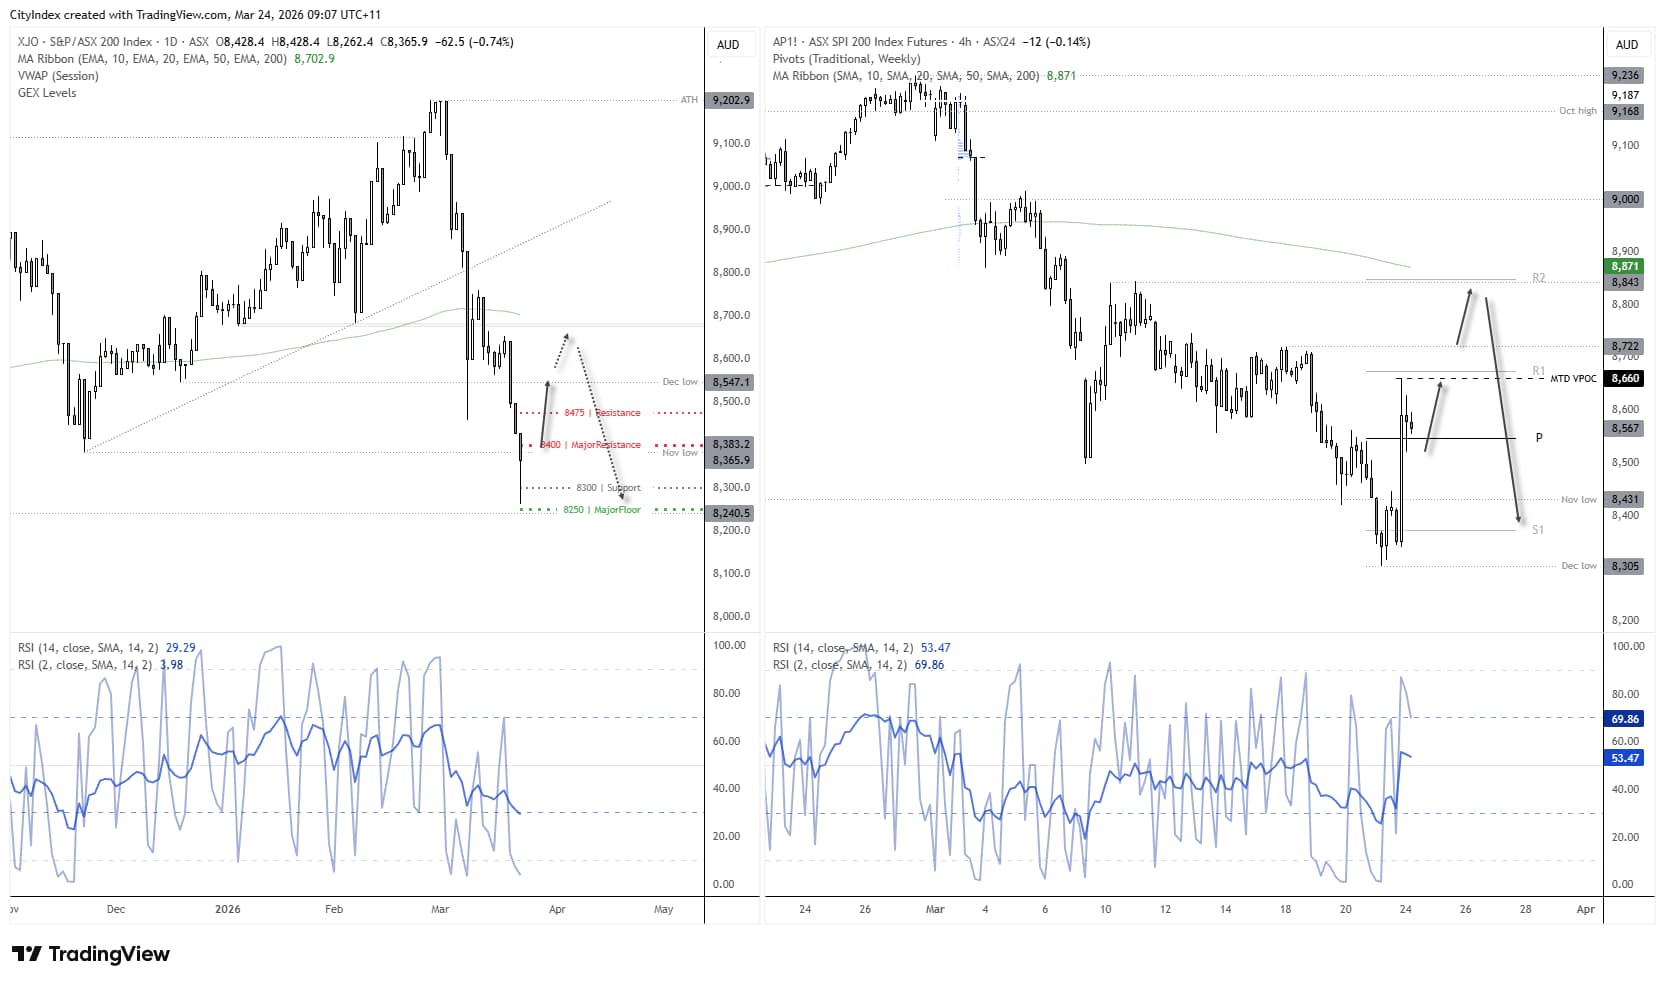
Monday’s options positioning shows the prior session’s low held above a major call cluster at 8250, with both the daily RSI (14) and RSI (2) in oversold territory. The cash market formed a bullish hammer with a long lower wick, while SPI 200 futures (right) show a strong rebound on the 4-hour chart—suggesting the cash market will gap higher on the open.
ASX futures met resistance around the month-to-date volume point of control (MTD VPOC) and monthly pivot point. A minor pullback could allow bulls to re-enter for a potential move higher. A break above 8722 exposes a run towards the 8800 handle, just below the 200-bar SMA, monthly R2 pivot, and the 8843 swing high.
Source: ASX, ASX24, TradingView
Nikkei 225 Futures (NK) Technical Analysis
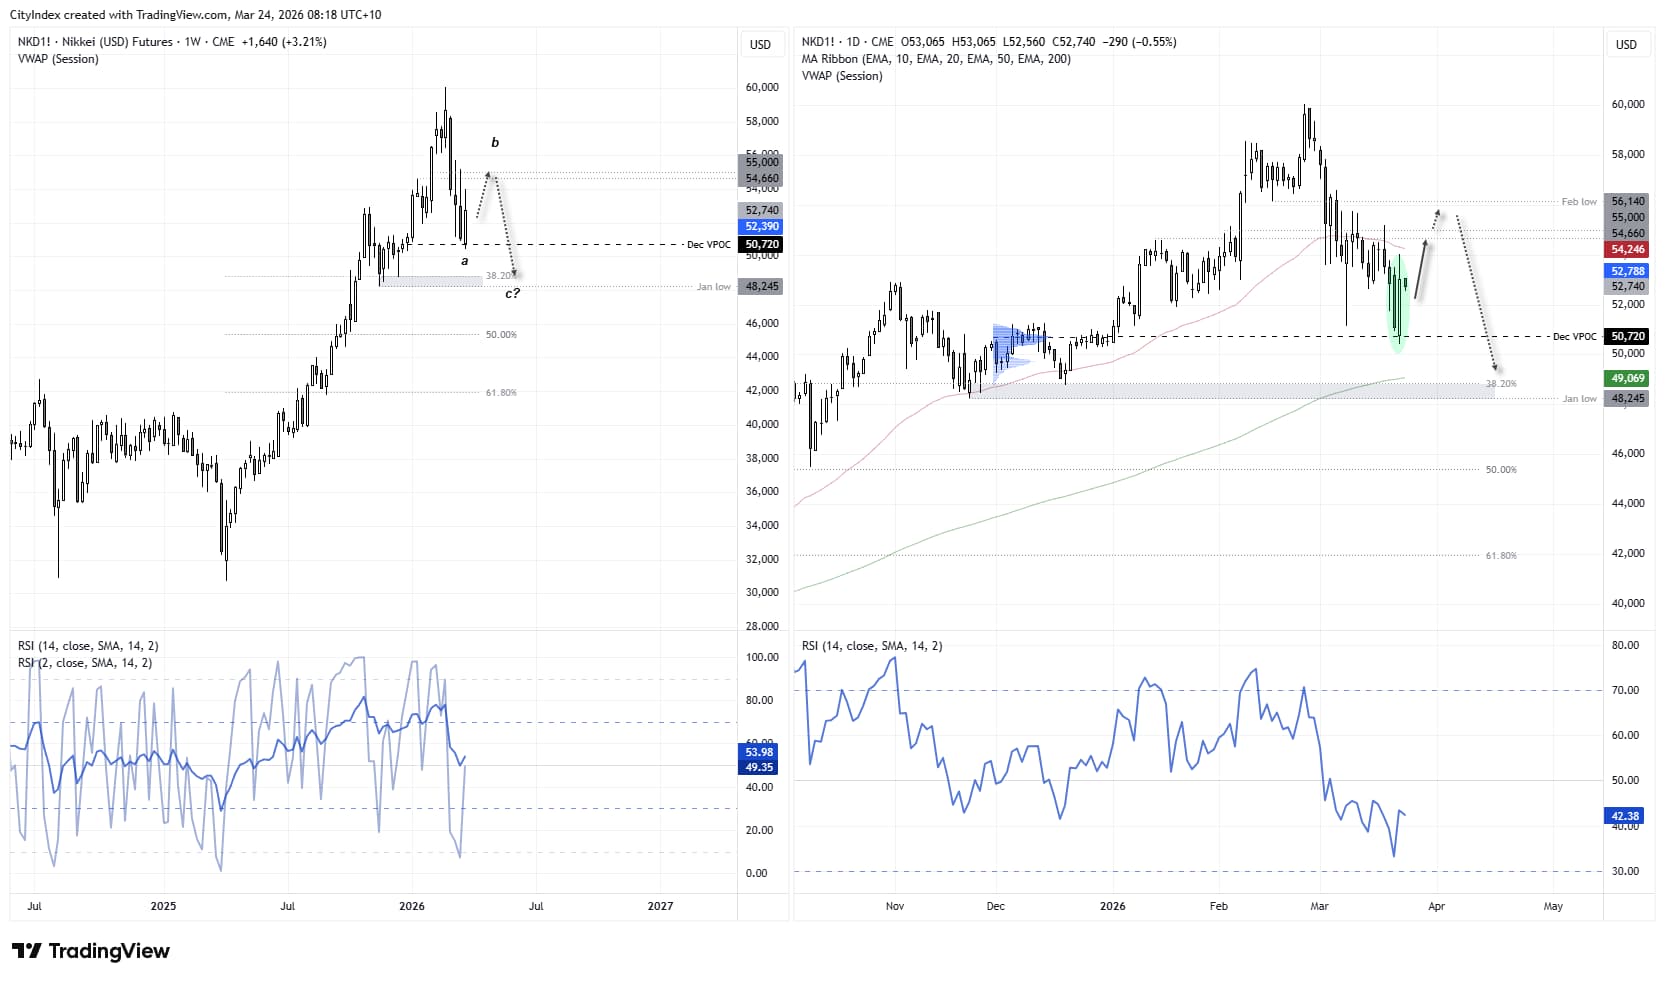
Nikkei futures have staged a decent rebound from the December VPOC, although the selloff from the record high is not yet out of the woods. Price action suggests only one impulsive leg lower has formed, raising the risk that any bounce here is a ‘wave B’ within a broader ABC correction.
That leaves scope for another leg lower towards ~49k, where the 200-day EMA, January low and 38.2% Fibonacci retracement converge.
Near-term momentum is pointing higher, so bulls may attempt a push towards 55k. However, while prices remain capped below 56k, the broader structure favours another leg lower towards 49k.
Source: CME, TradingView
View the full economic calendar
View the full economic calendar
-- Written by Matt Simpson
Follow Matt on Twitter @cLeverEdge
How to trade with City Index
You can trade with City Index by following these four easy steps:
- Open an account, or log in if you’re already a customer
• Open an account in the UK
• Open an account in Australia
• Open an account in Singapore
- Search for the market you want to trade in our award-winning platform
- Choose your position and size, and your stop and limit levels
- Place the trade



Open an account in minutes
Experience award-winning platforms with fast and secure execution, and enjoy tight spreads from 0.5 pts on FX and 0.3 pts on indices.
Economic calendar
Web Trader platform
Our sophisticated web-based platform is packed with features.
Related articles
Australian Dollar Outlook: AUD/USD Screams Sentiment Extreme Into Fed, CPI
AUD/USD rebounds despite record bearish futures positioning, with Australian Q3 CPI and the Fed meeting threatening to trigger another short squeeze.

S&P 500, Nasdaq, Dow Forecast: Nasdaq Selloff Deepens as Dow Rally Stalls 10 24 2026
A failed S&P breakout and looming Nasdaq support test raise the stakes for next week’s Fed decision and October’s monthly close.


Crude Oil Forecast: Weekend Iran Strike Fears Lift Oil Toward War Highs
Brent crude oil is accelerating above $110 as traders price in the risk of a US-Israeli strike on Iran over the weekend. How much more of a geopolitical premium can oil build in before the close?

This report is intended for general circulation only. It should not be construed as a recommendation, or an offer (or solicitation of an offer) to buy or sell any financial products. The information provided does not take into account your specific investment objectives, financial situation or particular needs. Before you act on any recommendation that may be contained in this report, independent advice ought to be sought from a financial adviser regarding the suitability of the investment product, taking into account your specific investment objectives, financial situation or particular needs.
StoneX Financial Pte. Ltd., may distribute reports produced by its respective foreign entities or affiliates within the StoneX group of companies or third parties pursuant to an arrangement under Regulation 32C of the Financial Advisers Regulations. Where the report is distributed to a person in Singapore who is not an accredited investor, expert investor or an institutional investor (as defined in the Securities Futures Act), StoneX Financial Pte. Ltd. accepts legal responsibility to such persons for the contents of the report only to the extent required by law. Singapore recipients should contact StoneX Financial Pte. Ltd. at 6826 9988 for matters arising from, or in connection with the report.
In the case of all other recipients of this report, to the extent permitted by applicable laws and regulations neither StoneX Financial Pte. Ltd. nor its associated companies will be responsible or liable for any loss or damage incurred arising out of, or in connection with, any use of the information contained in this report and all such liability is hereby expressly disclaimed. No representation or warranty is made, express or implied, that the content of this report is complete or accurate.
StoneX Financial Pte. Ltd. is not under any obligation to update this report.
Trading CFDs carries a high level of risk that may not be suitable for some investors. Consider your investment objectives, level of experience, financial resources, risk appetite and other relevant circumstances carefully. The possibility exists that you could lose some or all of your investments, including your initial deposits. If in doubt, please seek independent expert advice. Visit www.forex.com/en-sg/terms-and-policies for the complete Risk Disclosure Statement.